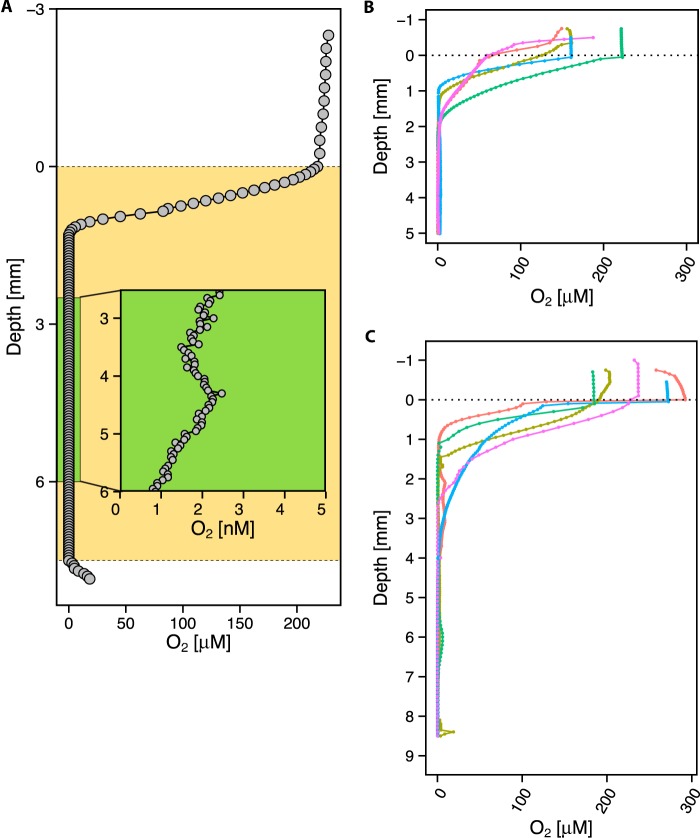
FIG 2 .
Representative oxygen microprofiles. (A) STOX microprofile, with the sputum sample marked in tan, representative of n = 8. The green rectangle shows an expanded view of a portion of the anoxic zone in the sputum sample. The detection limit is 2 nM. (B) Oxygen microelectrode profiles of 5-mm-deep expectorated sputum samples from 5 different patients, representative of n = 12. At the air-sputum interface, a steep oxycline begins and is followed by an anoxic zone that persists for the remaining portion of the sputum. (C) Oxygen microelectrode profiles of 8-mm-deep expectorated sputum samples from 5 different patients that were larger in volume, representative of n = 27. The same trend in profile occurs, with a steep oxycline followed by anoxia.

