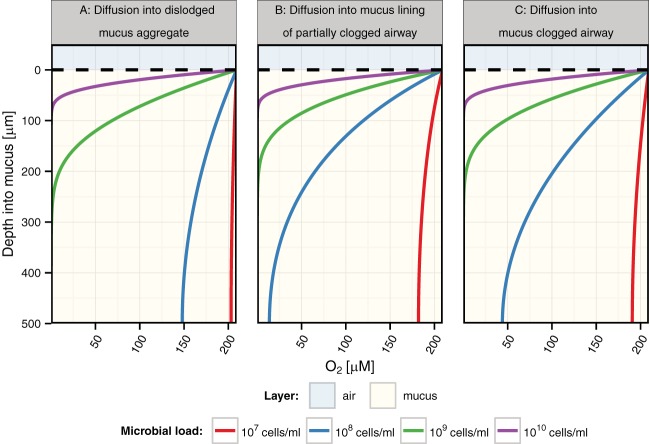
FIG 6 .
Comparison of levels of oxygen diffusion into mucus based on different respiratory airway geometry constraints and bacterial densities. Data represent oxygen diffusion into different respiratory airways clogged with mucus at various bacterial densities. The described scenarios correspond to the diagram in Fig. 1 with a modeled mucus thickness (x) of 500 µm and an airway diameter of 1.5 mm for scenario B (model scenarios A and C are not affected by the airway diameter). The upper blue shaded area indicates air, and the tan lower layer indicates mucus.

