
FIG 4 .
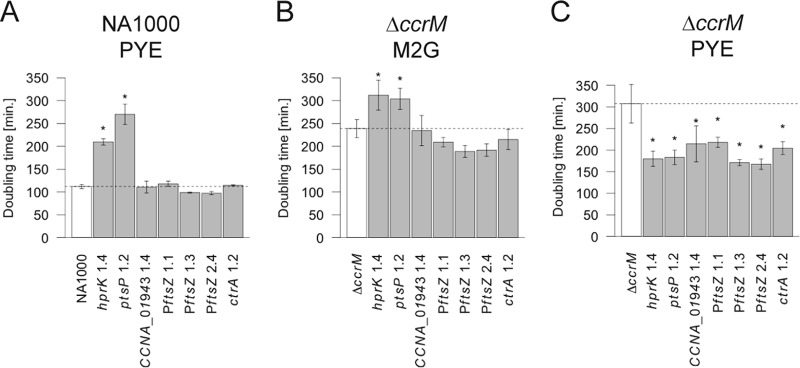
Growth rates of NA1000 and ΔccrM strains carrying a single point mutation in hprK, ptsP, CCNA_01943, the promoter region of ftsZ (PftsZ) (three different mutations), or ctrA. (A) Average growth rate in exponential phase of NA1000 mutants (hprK 1.4, JC1323; ptsP 1.2, JC1336; CCNA_01943 1.4, JC1327; PftsZ 1.1, JC1325; PftsZ 1.3, JC1328; PftsZ 2.4, JC1338; ctrA 1.2, JC1343) and control strains (NA1000, JC1322) in rich medium based on three replicates. (B) Average growth rate in exponential phase of ΔccrM mutant (hprK 1.4, JC1339; ptsP 1.2, JC1340; CCNA_01943 1.4, JC1344; PftsZ 1.1, JC1345; PftsZ 1.3, JC1341; PftsZ 2.4, JC1342; ctrA 1.2, JC1346) and control (ΔccrM, JC1347) strains in minimal medium based on three replicates. (C) Average growth rate of ΔccrM mutant and control strains during the 23 generations after transfer from minimal medium to rich medium based on two replicates. Error bars show standard deviations from the means; the dotted line represents the average for the control strain.