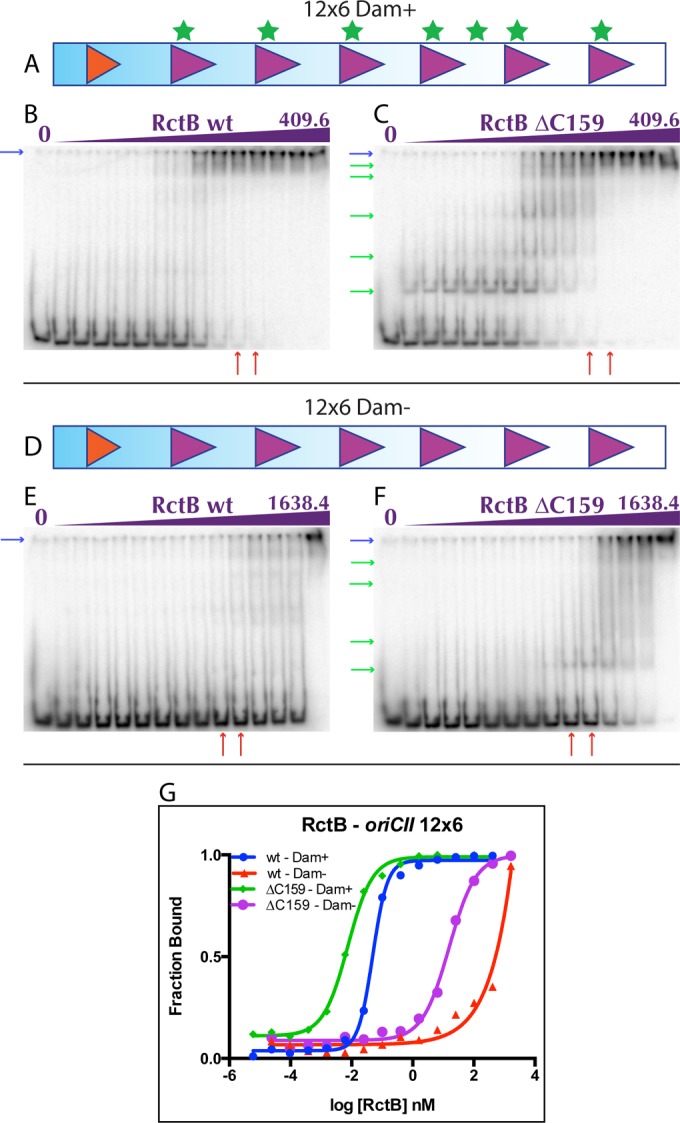
FIG 3 .

RctB binding to the 12×6 array of oriCII. Methylated (A) and unmethylated (D) probes used in the EMSAs shown in panels B and C and panels E and F, respectively. (B, C, E, and F) Representative EMSAs of WT RctB (B and E) and RctB ΔC159 (C and F) with methylated (B and C) and unmethylated (E and F) 12×6 probes. (G) Representative binding curves of EMSA quantifications. The concentrations of RctB ranged from 0.000006125 to 409.6 nm (B and C) and from 0.000025 to 1,638.4 nM (E and F) in 4-fold dilution series. Red arrows below the gels indicate RctB concentrations where near-maximal binding with the methylated 12×6 probe is shown in panels B and C.
