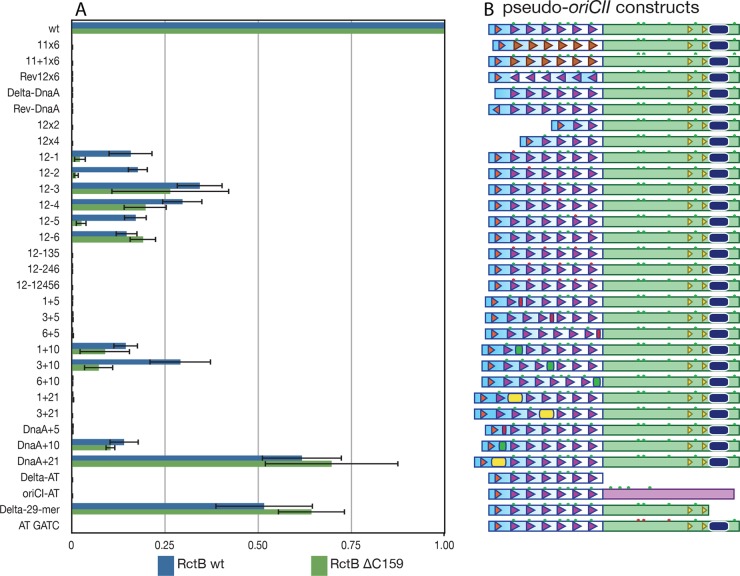
FIG 4 .
Few structural changes in oriCII-min maintain its replicative capacity. (A) CFU count for each oriCII pseudo-origin normalized to both a kanamycin control plasmid and a WT oriCII fragment. Mean ratios and standard errors of the means shown were obtained from three independent transformation experiments. (B) Schematics of the pseudo-oriCIIs. The symbols are the same as in Fig. 1; in addition, the red rectangles represent 5-bp insertions, green rectangles represent 10-bp insertions, yellow rectangles represent 21-bp insertions, and red stars indicate Dam methylation sites that were mutated to GTAC.

