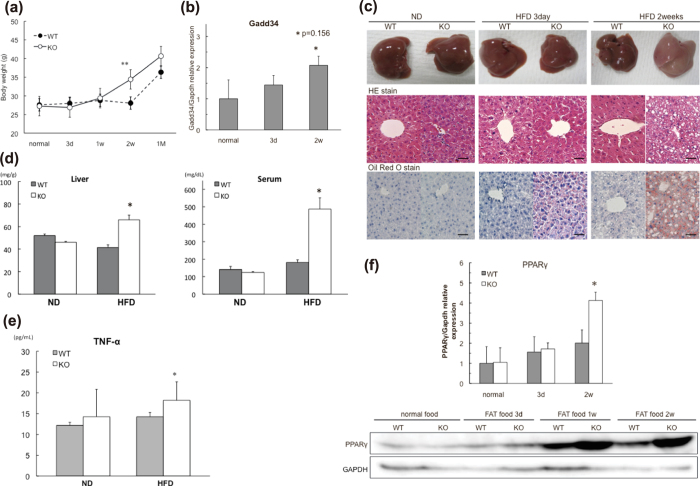
Figure 4. GADD34 deficiency promotes obesity induced by HFD.
(a) Body weight of WT and GADD34-deficient male mice (WT; n = 6, KO; n = 6) were measured at each time after HFD feeding. Data shown are the mean ratio ± SEM. (*p < 0.05, **p < 0.01). (b) GADD34 mRNA expression of the livers of WT mice fed HFD. Data shown are the mean ratio ± SEM. (*p = 0.156). (c) Pictures show the representative macroscopic photographs of the livers from WT mice (left) and GADD34-deficient (right) mice fed HFD. Sections were stained with H&E and Oil Red O. Scale bars represent 100 μm. (d) Concentration of TG in liver and serum in WT and GADD34-deficient mice fed HFD for 2 weeks. Data shown are the mean ratio ± SEM. (n = 5, *p < 0.05). (e) Concentration of TNF-α in serum from 3M old WT and GADD34-deficient mice fed ND (left) or 2 weeks of HFD (right) were analyzed by ELISA. (f) PPARγ mRNA expression of the livers of WT and GADD34-deficient mice fed HFD for 2 weeks. Samples were taken at 0, 3 days, one week or two weeks after the start of HFD. Data shown are the mean ratio ± SEM. (*p < 0.05). Protein expressions of the liver were analyzed by western blotting. The original immunoblots are presented in Supplemantary Figure 10b.

