
Figure 2. Alternations of activation of downstream effectors of mTOR signaling in PFC of CMS mice at 2 days post ketamine and Yueju administration.
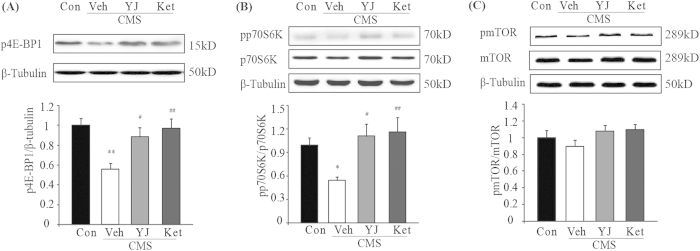
(A) Phosphorylation of 4E-BP1 level. ANOVA, F(3,20) = 6.138, p < 0.01. (B) Phosphorylated p70S6K (pp70S6K) normalized to total p70S6K, ANOVA, F(3,20) = 4.042, p < 0.05. (C) phosphorylated mTOR (p-mTOR) normalized to total mTOR, ANOVA, F(3,20) = 1.443, p = 0.265. *p < 0.05, **p < 0.01, compared with control group. #p < 0.05, ##p < 0.01, compared with vehicle group, and n = 5−7.