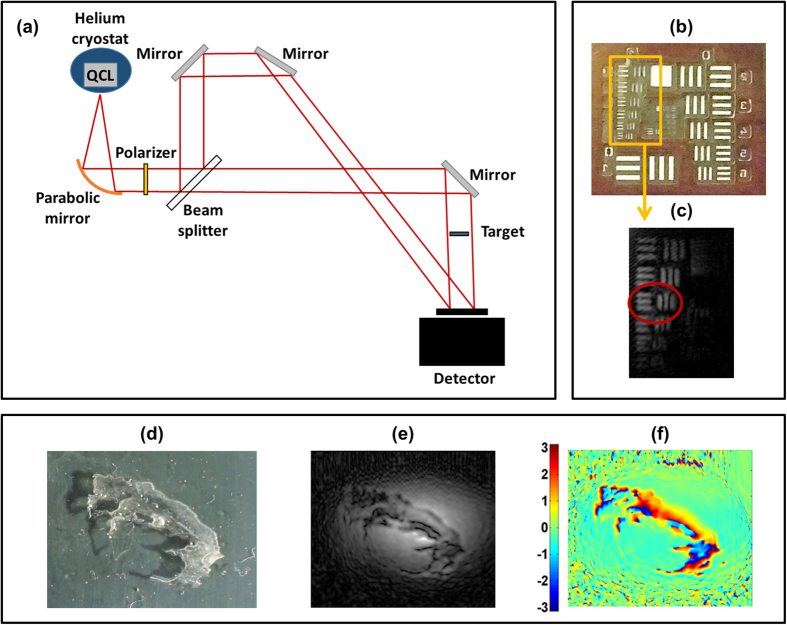
Figure 2. THz transmission DH.
(a) Sketch of the experimental setup. (b) 1951 USAF resolution test chart R 74 (group 1 inside the yellow square). (c) Wavefront amplitude reconstruction of the lines belonging to group 1 (in the red circle, element 3 lines, with a thickness of 227 μm). (d) Picture of a 30 μm thick human skin histological slice. (e,f) Reconstructed amplitude (e) and phase (f) of the transmitted THz wavefront.

