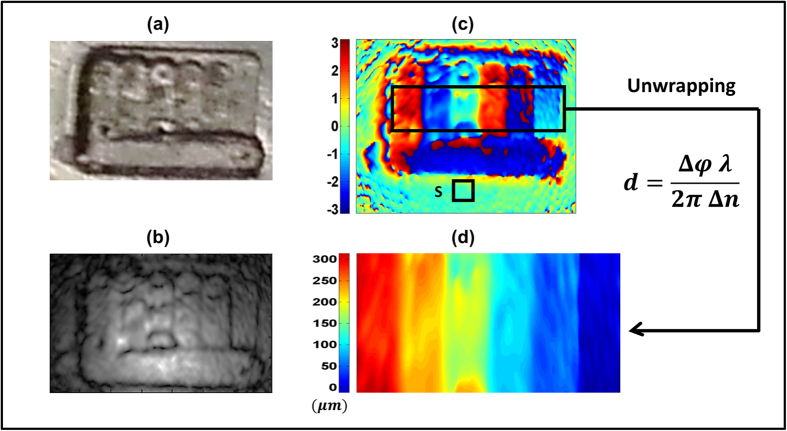
Figure 3. THz optical path length measurement.
(a) Picture of the measured black polypropylene sheet with six, 1 mm wide, grooves of depth increasing by 50 μm steps. (b,c) Reconstructed amplitude (b) and phase (c) of the transmitted THz wavefront. S is the flat portion of the sheet considered for the calculation of the vertical resolution limit. (d) Particular of the wavefront phase reconstruction after phase unwrapping and rescaling from phase to depth.

