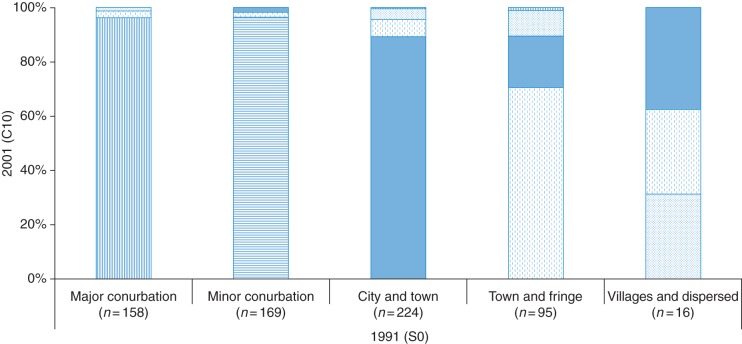
Fig. 1.
The direction of relocation: people relocating between the baseline and year 10 and their rural/urban categories (n = 662, 27.8%). Each pattern represents one rural/urban category. Straight line indicates major conurbation, horizontal line indicates minor conurbation, plain represents city and town, dash denotes town and fringe and dot indicates villages and dispersed. The proportion of people moved to different (various pattern) categories or within same (same pattern) rural/urban categories over 10 years; for example, in the Town and Fringe 1991, over 70% of people moved within the same category (dash); nearly 19% of people living in Town and Fringe in 1991 moved to City and Town (plain) in 2001.

