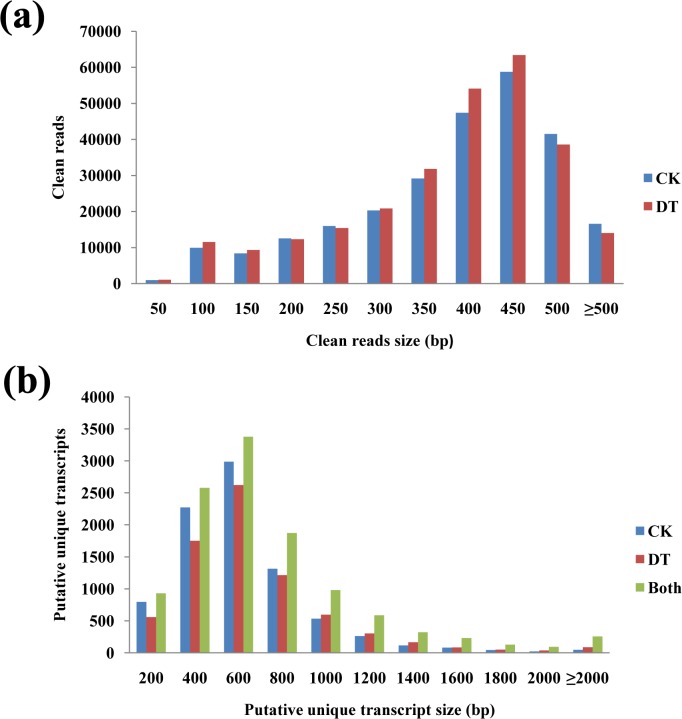
Fig 1. Size distribution of clean sequence reads and putative unique transcripts.
Comparison of the length distributions of cleaned reads (a) and putative unique transcripts (b) from 454 pyrosequencing of control (CK) and drought-treated (DT) samples. Blue bars refer to CK data; Red bars refer to DT data; Green bars in graph B refer to PUTs from global (combined) assembly.

