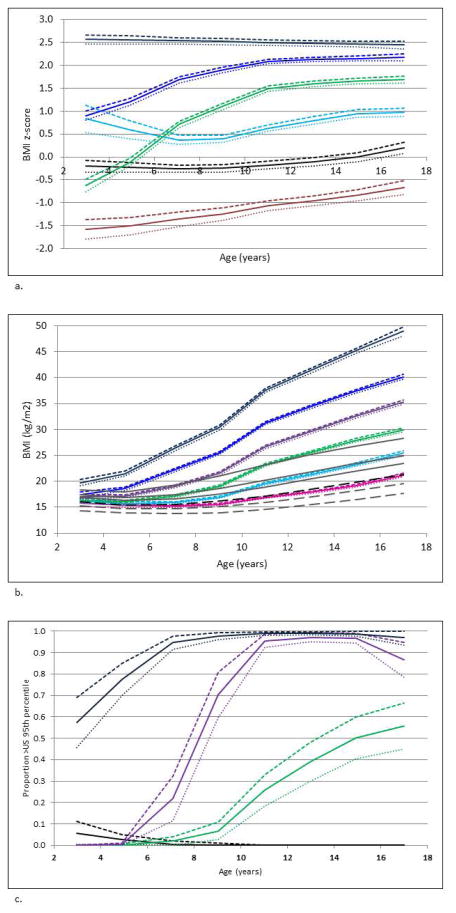
Figure 1. Classes Identified by Latent Class Trajectory Analysis.
(a) Six Classes of BMI z-score Change Occurring during Childhood Identified. Brown = Below Average BMI (10% of study population), black = Average BMI (15%), green = Lean Increasing to Overweight (23%), light blue = Stable Above Average BMI (22%), blue = High Increasing BMI (26%), navy = Chronic Overweight (4%). (b) Six Classes of BMI Change Occurring during Childhood Identified. Gray dashed lines = 5th and 25th BMI percentiles for the United States population, black dashed line = 50th BMI percentile for the US population, solid gray lines = 75th, 85th, 95th percentiles for the US population. Pink = trending 50th percentile (20%), light blue = increasing to 85th percentile (25%), green = increasing to 95th percentile at puberty (21%), purple = increasing to 95th percentile prepuberty (19%), blue = increasing to 95th percentile early (11%), navy = Chronic Overweight (4%). (c) Four Classes of Progressing to a Weight Greater than the 95th Percentile during Childhood Identified. Black = always lean (45%), green = developing risk of overweight at puberty (19%), purple = developing risk of overweight prepuberty (19%), navy = chronic risk of overweight (17%). Lower 95th percent confidence intervals are shown by dotted lines, higher 95th percent confidence intervals are shown by dashed lines.

