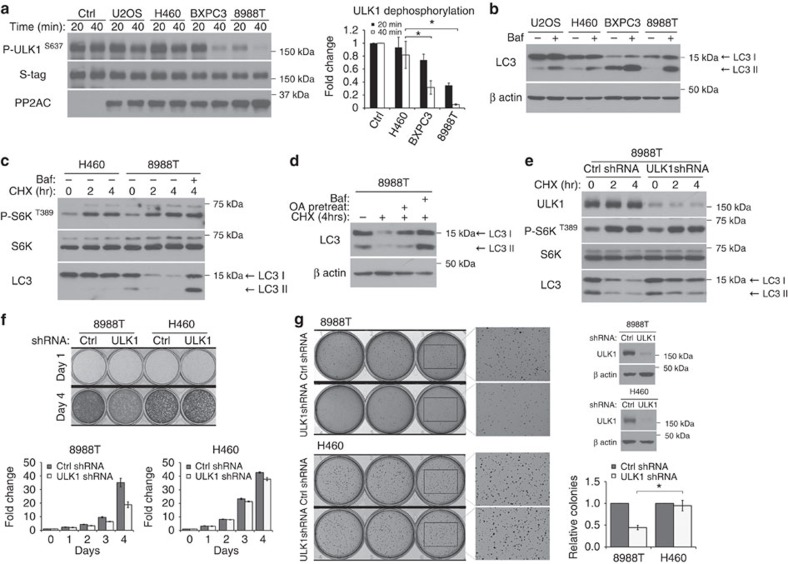
Figure 7. Phosphatase activity drives high basal levels of autophagy in pancreatic ductal adenocarcinoma cell lines to support cancer cell growth.
(a) Pancreatic ductal adenocarcinoma (PDAC) cell lines have high phosphatase activity. In vitro phosphatase assay was carried out using Flag-S–ULK1 as a substrate and 10 μg of total cell lysates from indicated cancer cell lines. Left panel shows immunoblot of ULK1 S637 dephosphorylation, and right panel shows quantitation (fold change ± s.d., n=3. two-tail Student's t-test, *P<0.05). (b,c) PDAC cell lines have high basal autophagy. In b, cell lines were kept in complete media in the presence or absence of 20 nM bafilomycin (Baf) for 90 min and lysed for immunoblotting of endogenous LC3. In c, PDAC cell line 8988T and control cell line H460 were kept in complete media with 20 μg ml−1 cycloheximide (CHX) for the indicated time. Where indicated, 10 nM Baf was added at the start of CHX treatment. (d) Phosphatase activity is required for basal turnover of LC3. 8988T was treated as in c. To assess phosphatase involvement, cells were pretreated with 200 nM okadaic acid in full media for 2 h and removed at the start of CHX treatment. (e) ULK1 complex is required for basal LC3 turnover. 8988T cells were transduced with control shRNA or shRNA targeting ULK1. Cells were treated with 20 μg ml−1 CHX for the indicated time and immunoblotted for endogenous LC3. (f) ULK1 complex is required for robust proliferation of 8988T cells. Equal number of 8988T or H460 cells stably expressing control shRNA or shRNA targeting ULK1 were seeded on day 0. Upper panel shows cells fixed and stained with crystal violet on day 1 and day 4 respectively. Histograms on the lower panel show quantitation of crystal violet stain over time, relative to day 0. Error bars are standard deviation from triplicates. (g) ULK1 complex is required for sustained anchorage-independent growth of 8988T. Cell lines in f were used in a soft agar assay. Representative images and knockdown efficiencies are shown. Histogram shows quantitation of colonies in each cell line relative to control shRNA (relative colony number±s.d., n=3. two-tail Student's t-test, *P<0.05).

