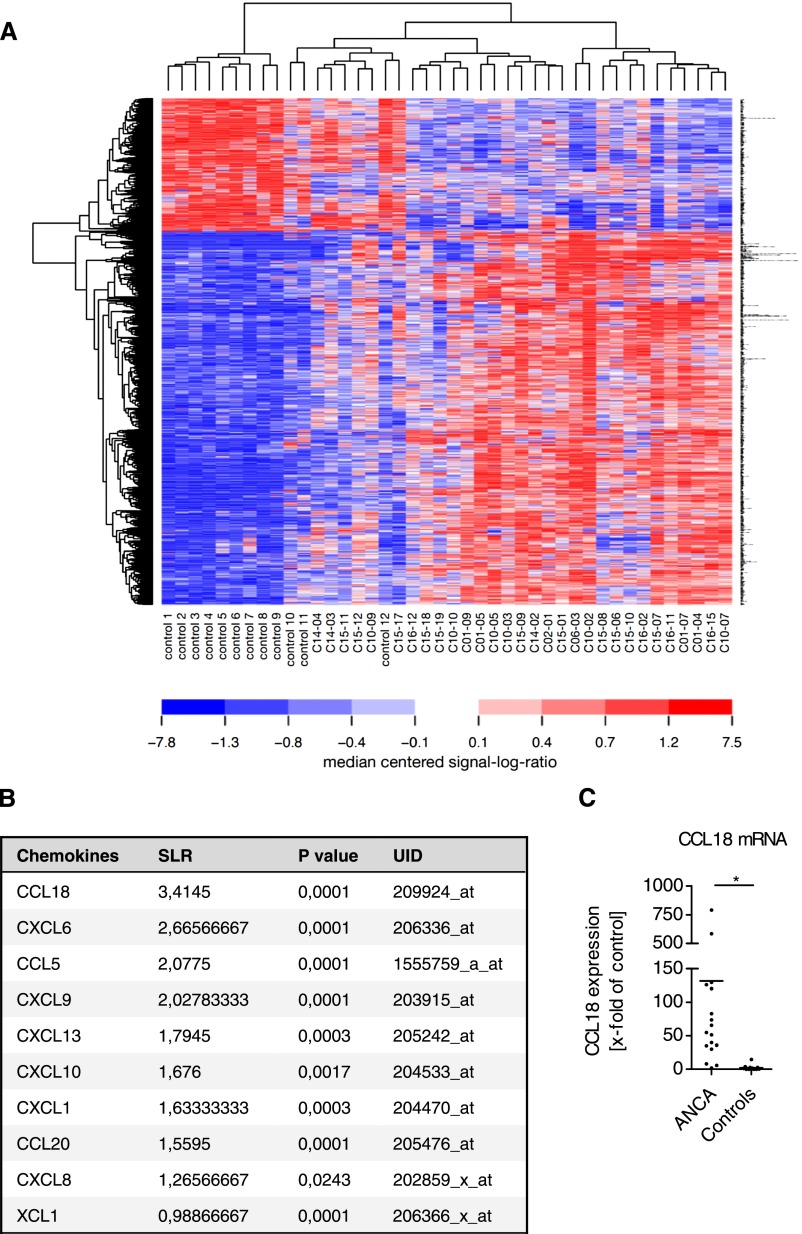
Figure 2.
Microarray analysis shows CCL18 as the highest upregulated transcript among all chemokines in ANCA-associated crescentic GN. (A) Heat map of differentially regulated transcripts in ANCA-associated crescentic GN compared with control kidneys. The RNA from 30 patients with ANCA-associated crescentic GN and 12 controls (preimplantation kidney biopsies of living or deceased kidney donors) was used for the microarray analyses. Total RNA was isolated from FFPE renal biopsies. Transcripts shown in this heat map had a signal log ratio≥2.3 and ≤−2.3 and were considered differentially expressed. Each column represents one biopsy sample, and each row shows the results for one probe set per transcript. Blue indicates downregulation of the probe sets, and red indicates upregulation of the probe sets. Areas in white represent no regulation. (B) Summary of the chemokines assessed. The unique identification number (UID) is indicated for each sample. A signal log ratio (SLR) of 3.41 was obtained for CCL18. (C) Quantitative real-time PCR analysis confirmed the high level of CCL18 expression. Total RNA from FFPE kidney biopsies was examined for CCL18 expression (Hs00268113_m1; Life Sciences) in relation to the levels of 18S RNA (Hs03928985_g1; Life Sciences). Renal CCL18 expression was 98 times higher in ANCA-associated crescentic GN (n=14) compared with controls (n=12). Bars represent means±SDs. *P<0.05.

