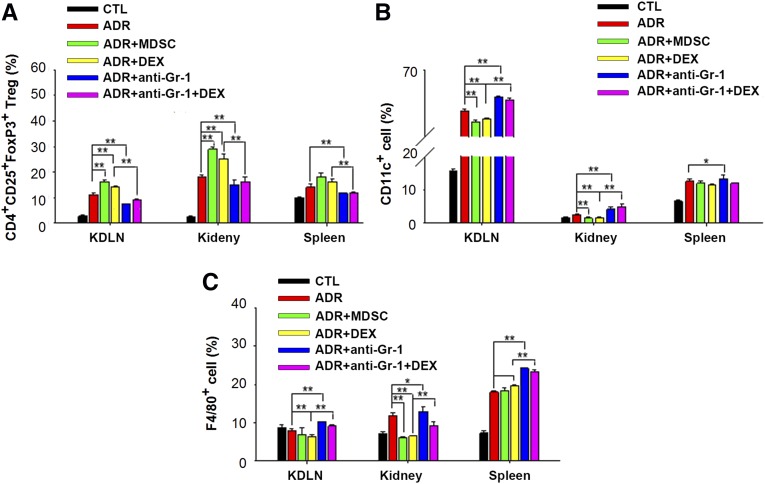
Figure 7.
MDSCs increased the level of Tregs but decreased the levels of inflammatory leukocytes in mouse KDLN, kidney, and spleen. (A–C) FACS analysis of CD4+CD25+FoxP3+ Tregs (A), CD11c+ cells (B), and F4/80+ cells (C) in KDLNs, kidney, and spleen from mice administered saline (CTL); doxorubicin (Adriamycin [ADR]); doxorubicin and BM-MDSCs (ADR+MDSC); doxorubicin and dexamethasone (DEX; ADR+DEX); doxorubicin and anti–Gr-1 antibody (ADR + anti–Gr-1); or doxorubicin, anti–Gr-1 antibody, and DEX (ADR+anti–Gr-1+DEX) for 2 weeks. The y-axis is defined as percentages of CD4+CD25+FoxP3+ cells (A), CD11c+ cells (B), and F4/80+ macrophages (C) in total splenocytes (Spleen), KDLN cells, and mononuclear cells in kidney (Kidney) after depletion of red blood cells, respectively. Data are shown as the mean±SEM (n=3; six samples per group). *P<0.05; **P<0.01.

