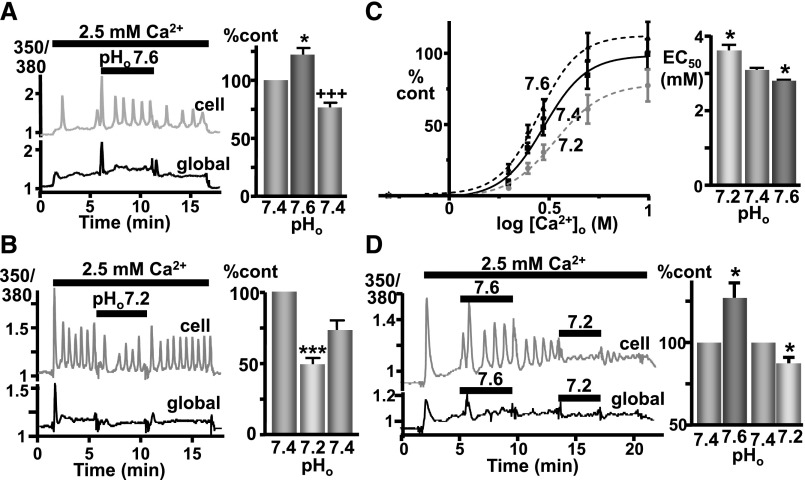
Figure 1.
CaR-induced Ca2+i mobilization is sensitive to pathophysiologic pHo changes in CaR-HEK cells. (A) Representative trace showing Ca2+i changes (Fura-2 ratio) in a single cell (upper trace, “cell”) and “global” (lower trace) cluster of (>10) cells in response to elevated [Ca2+]o (2.5 versus 0.5 mM control) when pHo was changed from 7.4 to 7.6. Changes in [Ca2+]i shown as percentage control of the area under the curve. n=4 coverslips. (B) Identical except testing the effect of decreased pHo (7.2). n=4 coverslips. *P<0.05 and ***P<0.001 versus first pH 7.4 treatment; +++P<0.001 versus pH 7.6 treatment by repeated-measures ANOVA (Tukey post-test) performed on the raw data. (C) Cells were exposed to buffers containing increasing concentrations of Ca2+o (0.5–10 mM) with pHo 7.2, 7.4, or 7.6 with the resulting concentration-effect curves for Ca2+i mobilization shown (left) together with their half maximal effective concentration (EC50) (right). While the EC50 values were significantly different, the maximal responses were not significantly different, despite the apparent trend. *P<0.05 versus pH 7.4 by repeated-measures ANOVA (Dunnett) performed on log EC50 values from four independent experiments (two to five coverslip replicates per data point, >15 cells per coverslip). (D) Similar results were obtained with use of bicarbonate/CO2 buffers, with pH 7.6 increasing Ca2+i mobilization and pH 7.2 decreasing mobilization in a single cell (upper trace) and “global” cluster of (>10) cells (lower trace) in response to 2.5 mM Ca2+o as before. Relative changes in [Ca2+]i are shown in the bar graph. The appropriate pH values were obtained by varying the bicarbonate (and NaCl) concentrations in buffers gassed continuously with 5% CO2/95% O2 (g). For the complete methods, see the Supplemental Material. *P<0.05 versus pH 7.4 treatment by one-tail paired t test; n=7 coverslips.

