Figure 2.
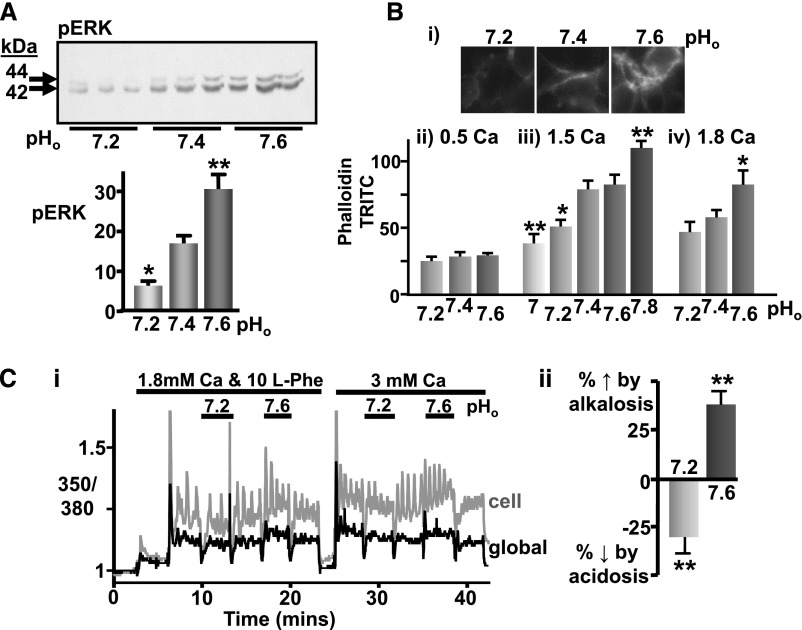
Pathophysiologic pHo changes also affects CaR-induced ERK activation, actin polymerization, and L-Phe responsiveness in CaR-HEK cells. (A) Representative immunoblot showing ERK phosphorylation (pERK) after treatment with 3.5 mM Ca2+o for 10 minutes under different pHo conditions (7.4±0.2). Mean changes in ERK phosphorylation were determined by densitometry and expressed on a bar graph in arbitrary units. n=9 dishes from two independent experiments. *P<0.05 and **P<0.01 versus pHo 7.4 by one-way ANOVA (Dunnet). (B) Representative immunofluoresence images (i) showing phalloidin-TRITC staining following CaR-HEK treatment with 1.5 mM Ca2+o for 3 hours in buffers of pHo ranging from 7.2 to 7.6. Quantification presented on a bar graph as pixels (phalloidin-TRITC) per unit area in five randomly selected regions of the cells is shown below (iii). Also shown are bar graphs from separate experiments where the cells were exposed to 0.5 (ii) or 1.8 (iv) mM Ca2+o. n≥5 coverslips. *P<0.05 and **P<0.01 versus pHo 7.4 by one-way ANOVA (Dunnet). (C) Representative Ca2+i trace (i) showing CaR-HEK cells stimulated first with 10 mM L-Phe (in 1.8 mM Ca2+o) and then with 3 mM Ca2+o under various pHo conditions as shown (0.5 Ca2+o, baseline, pH 7.4 unless otherwise stated). The traces include a typical response in a single cell (gray) as well as the total response in the cell cluster (>10 cells; “global”, black). Quantification (ii) is shown as a bar graph (percentage change in L-Phe responsiveness relative to pHo 7.4 control). n=7 coverslips from two independent experiments. **P<0.01 by repeated-measures ANOVA (Bonferroni).

