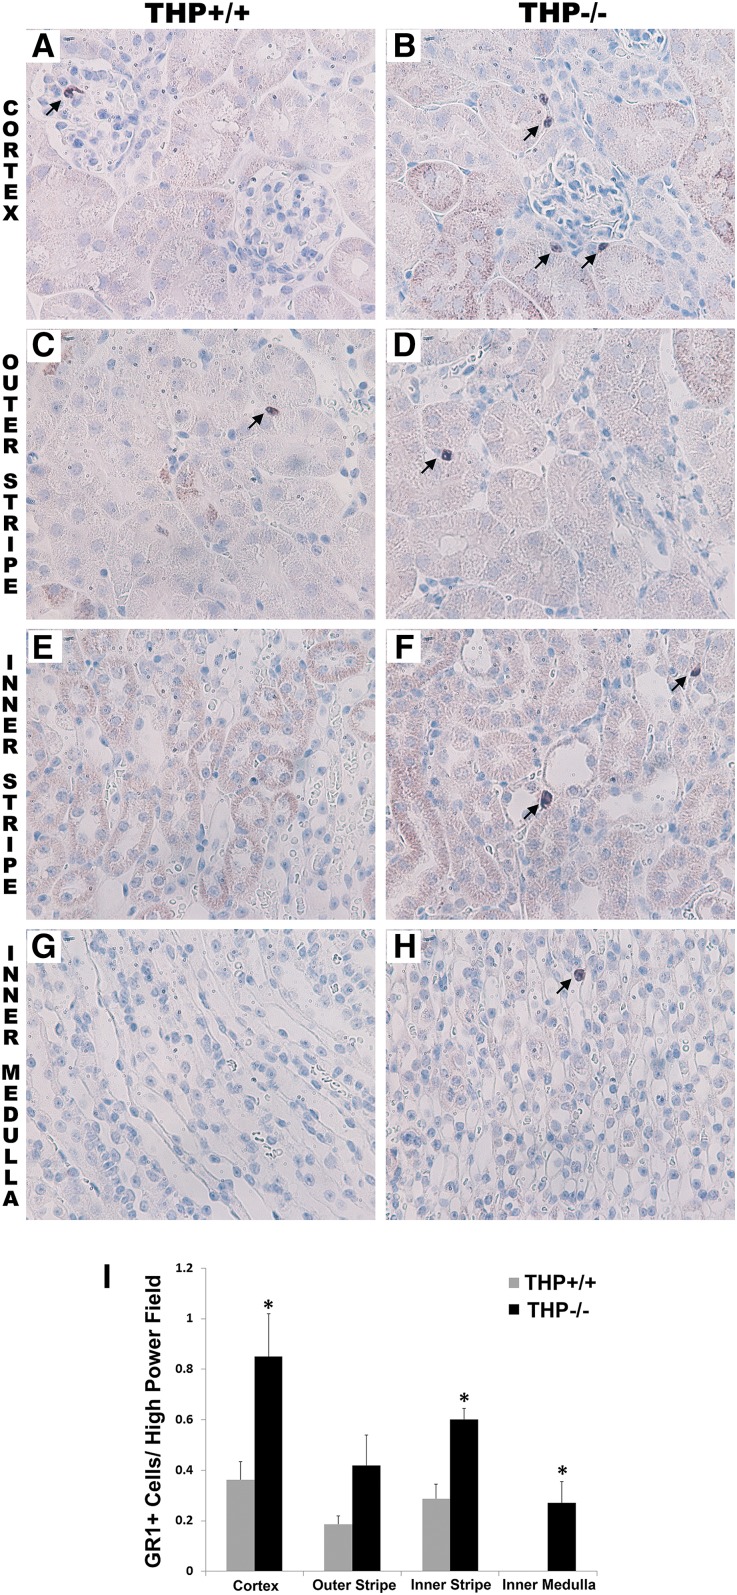
Figure 1.
Immunohistochemistry of GR1 in THP+/+ and THP−/− kidney sections. (A–H) Representative images of sections (two sections/kidney, five kidneys per group) encompassing all areas within the kidney from THP+/+ and THP−/− mice. Arrows show GR1-stained cells in various areas within the kidney. (I) Quantitation of GR1+ cells in each renal zone. Bar graphs are means±SEM. Asterisks represents statistical significance between the two strains (P<0.05). Original magnification, ×60 objective.

