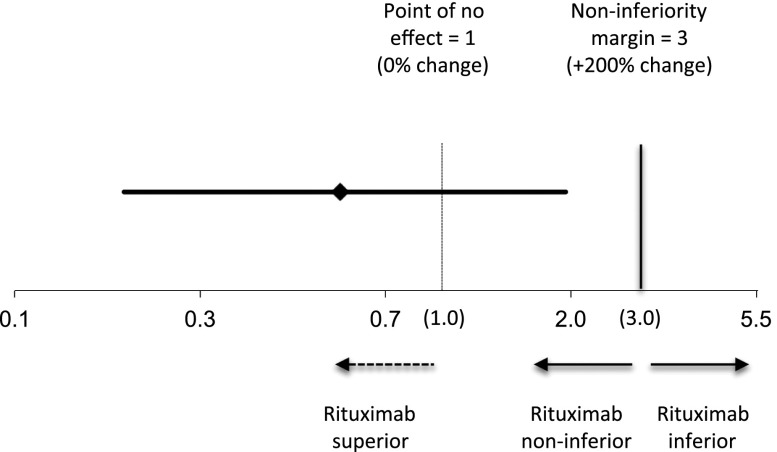
Figure 3.
Graphical representation of the analysis of covariance model. The effect of rituximab is measured as ratio of geometric means of proteinuria at 3 months (0.58; 95% CI, 0.18 to 1.95). The upper limit of the CI (1.95) is smaller than the prespecified noninferiority margin of 3, corresponding to a 200% increment in proteinuria compared with the control group. For results of this analysis see Table 2.

