
Figure 1.
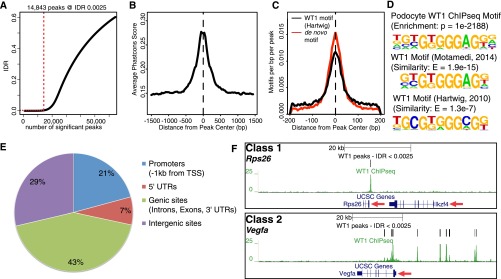
WT1 ChIPseq reproducibly identifies WT1 binding at two different classes of podocyte target genes. (A) Identification of reproducible WT1 binding sites (peaks) by IDR (irreproducible discovery rate) analysis. Red dotted lines indicate the number of peaks at the given IDR threshold. 14,843 peaks are identified at an IDR of 0.25%. (B) Distribution of average cross-species conservation scores (Phastcons) within WT1 peaks indicates increased conservation in peak centers and identification of conserved WT1 binding sites. Dotted line represents the peak center. (C) Localization of a podocyte and previously published WT1-binding motif within WT1 peaks shows enrichment of WT1 motifs in peak centers, confirming the validity of WT1 ChIPseq. (D) Podocyte-derived WT1 binding motif compared with previously published WT1 motifs identified in ChIP-on-chip (ref. 6) and ChIPseq (ref. 7) experiments in embryonic kidneys. The de novo podocyte motif yields highly significant enrichment and similarity scores. (E) Pie chart representing the distribution of WT1 peaks within the annotated genome. One-third of WT1 peaks were located in promoters and 5′-UTRs; most of the sites was found in genic/ intergenic loci. (F) Genome browser plots of WT1 binding sites, gene location, and cross-species conservation showing representative examples for the two different classes of WT1 target genes. Class 1 targets are bound exclusively close to their TSSs as shown for Rps26, whereas class 2 genes have additional binding sites in genic/intergenic regions within the genes’ cis-regulatory domains as shown for Vegfa. Red arrows: direction of transcription.