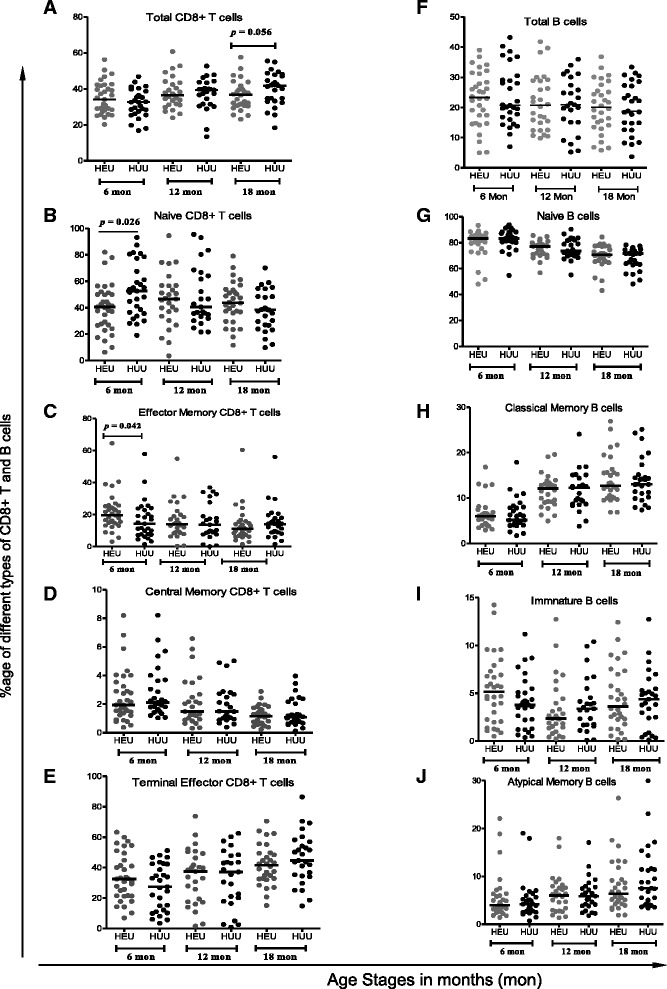
Fig. 1.

Proportions of different subsets of CD8+ T cells and B cells in HEU and HUU children at different age: Figures a represents percentage of CD8+T cells out of total lymphocytes, b naïve CD8+ T cells, c effector memory CD8+ T cells, d central memory CD8+ T cells and e terminal effector CD8+ T cells. Figures f represents proportion of CD19+ B cells as a percentage of total lymphocytes, g naive B cells, h classical memory B cell, i immature transitional B cells and j atypical memory B cells. Horizontal bars represent medians. Comparison between groups was performed with Mann Whitney U test. A difference with a p value of less than 0.05 was considered to be statistically significant
