Figure 1.

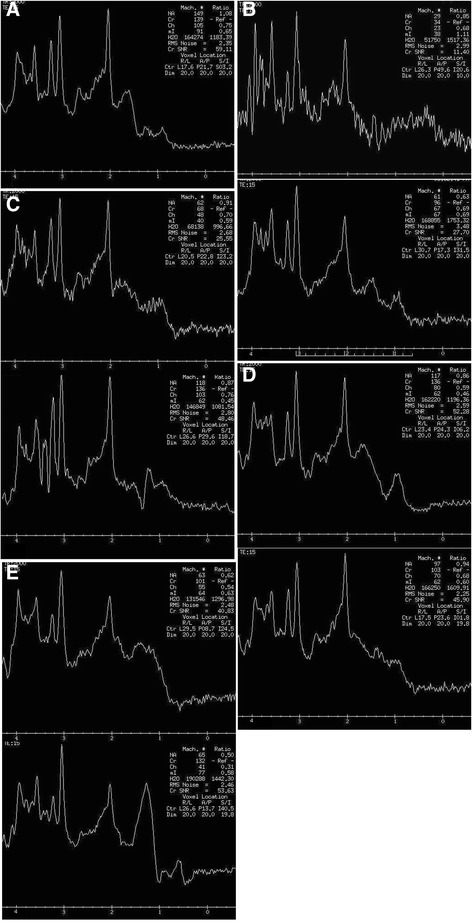
The MR spectroscopy of the patients at the initial (upper) and follow-up (lower) assessments. (A) healthy controls, (B) SCA2, (C) SCA3, (D) SCA6 and (E) MSA-C.

The MR spectroscopy of the patients at the initial (upper) and follow-up (lower) assessments. (A) healthy controls, (B) SCA2, (C) SCA3, (D) SCA6 and (E) MSA-C.