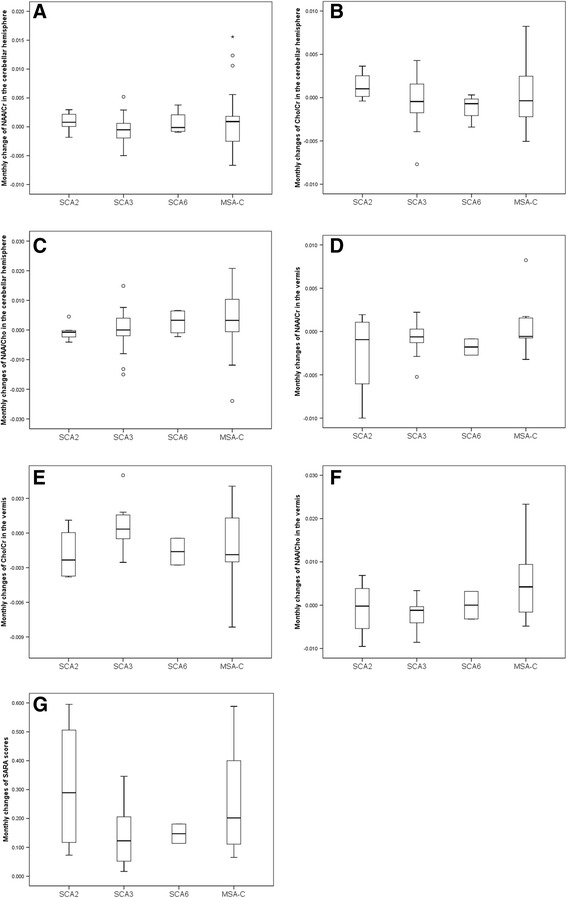
Figure 2.

Monthly changes of the MRS metabolites and the SARA scores. (A) NAA/Cr in the cerebellar hemispheres, (B) Cho/Cr in the cerebellar hemispheres, (C) NAA/Cho in the cerebellar hemispheres, (D) NAA/Cr in the vermis, (E) Cho/Cr in the vermis, (F) NAA/Cho in the vermis. (G) Changes of total SARA scores.
