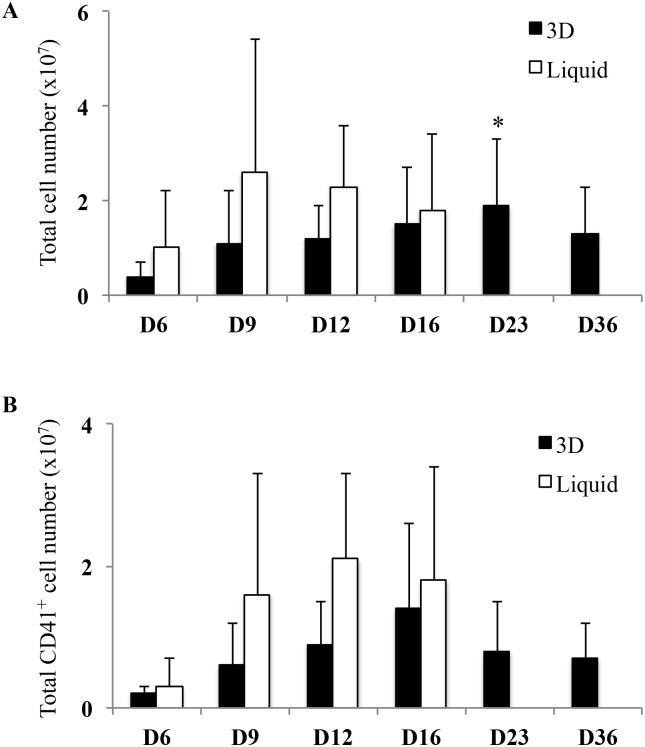
Fig 2. Comparison of total cell number and total CD41+ cell number in 3D environment and in liquid culture.
(A) Histogram representation of total cell number at different days of culture in 3D (black bars) and liquid culture (white bars). Proliferation was determined by cell imaging (Histolab), rather than by colorimetric assay, as polysaccharides produced a high background in the pNPP and MTT assays. Data are means ± SEM of 3 independent experiments. In 3D, late time points (D23 and D36) were compared to day 6. *p<0.05. Some cells exit from hydrogel pores, accumulated at the bottom of the wells (see Fig 1A) and therefore dismissed from the counts. Thus, only cells visible inside the pores of the 3D hydrogel were analyzed. (B) Histogram representation of total CD41+ cell number in 3D (black bars) and liquid culture (white bars) at different days of culture. Total CD41+ cell number was determined by multiplying the total cell number by the frequency of CD41+ cells. Data are means ± SEM of 3 independent experiments. In 3D, late time points (D23 and D36) were compared to day 6. Abbreviation: TCN, total cell number.

