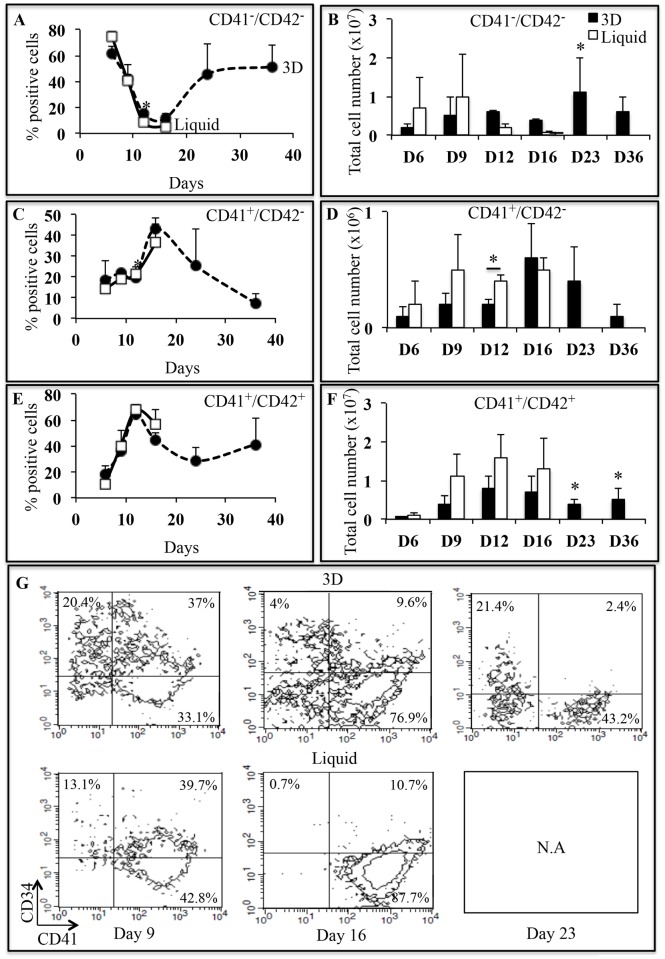
Fig 3. Characterization of MK differentiation as a function of time.
(A, C, E) Frequency of non-megakaryocytic cells (CD41-/CD42b-), MK precursors (CD41+/CD42b-) and mature MK (CD41+/CD42b+) in 3D (closed circles, dotted lines) and liquid culture (open squares, full lines) between day 6 and day 36. Data are means ± SEM of 3 independent experiments.*p<0.05. In 3D, late time points (D23 and D36) were compared to day 6. (B) Histogram representation of total CD41-/CD42b- cell number in 3D (black bars) and liquid culture (white bars) at different days of culture. (D) Histogram representation of total CD41+/CD42b- cell number in 3D (black bars) and liquid culture (white bars) at different days of culture. (F) Histogram representation of total CD41+/CD42b+ cell number in 3D (black bars) and liquid culture (white bars) at different days of culture. Total cell number of each MK population was determined by multiplying the total cell number by the frequency of each MK population. Data are means ± SEM of 3 independent experiments. In 3D, late time points (D23 and D36) were compared to day 7. *p<0.05. (G) CD41/CD34 dot plots of one representative experiment of 3 independent experiments in 3D and liquid culture on days 9, 16 and 23. Abbreviation: TCN, total cell number.

