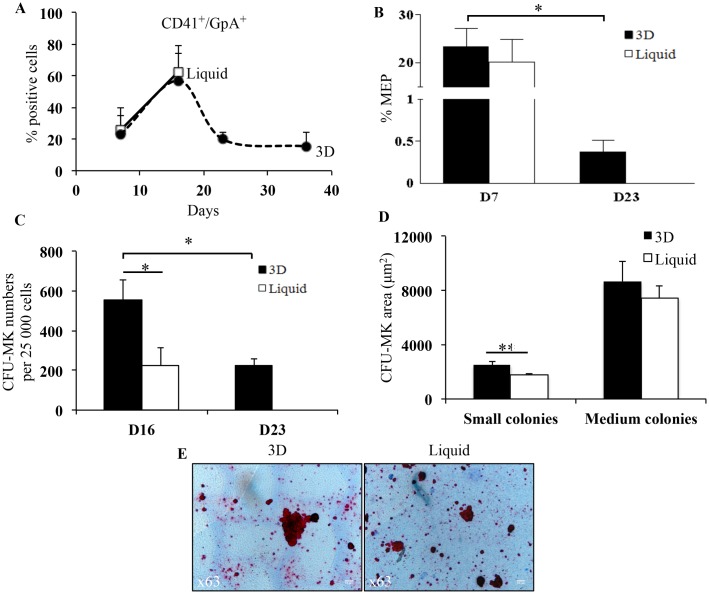
Fig 4. Characterization of CFU-MK and MEP.
(A) Frequency of CD41+/GpA+ cells in 3D (closed circles, dotted lines) and liquid culture (open squares, full lines) between day 7 and day 36. Data are means ± SEM of 4 independent experiments. In 3D, late time points (D23 and D36) were compared to day 7. (B) Frequency of MEP in 3D (black bars) and liquid culture (white bars) on days 7 and 23. Data are means ± SEM of 4 independent experiments. *p<0.05 between day 7 and day 23 in 3D. (C) Total number of CFU-MK produced from the expansion of 25 000 CD34+ cells in 3D (black bars) and liquid culture (white bars) on days 16 and 23. Data are means ± SEM of 4 independent experiments.*p<0.05. In 3D, day 23 was compared to day 16. (D) Histogram representation of CFU-MK areas on small and medium colonies, in 3D (black bars) and liquid culture (white bars) on day 16. Small and medium colonies were previous classified according to standard classification: small colonies; 3–21 cells/colony and medium colonies; 21–50 cells/colony. Data are means ± SEM of 90 independent colonies. **p<0.01. (E) Representative images of CFU-MK areas in 3D and liquid culture on day 16. Images were acquired using the Leica DM40000 B transmission optical microscope with 63X objective. Bar = 10 μm. Abbreviations: CFU-MK, colony forming unit-megakaryocyte; MEP, megakaryocyte-erythroid progenitors.

