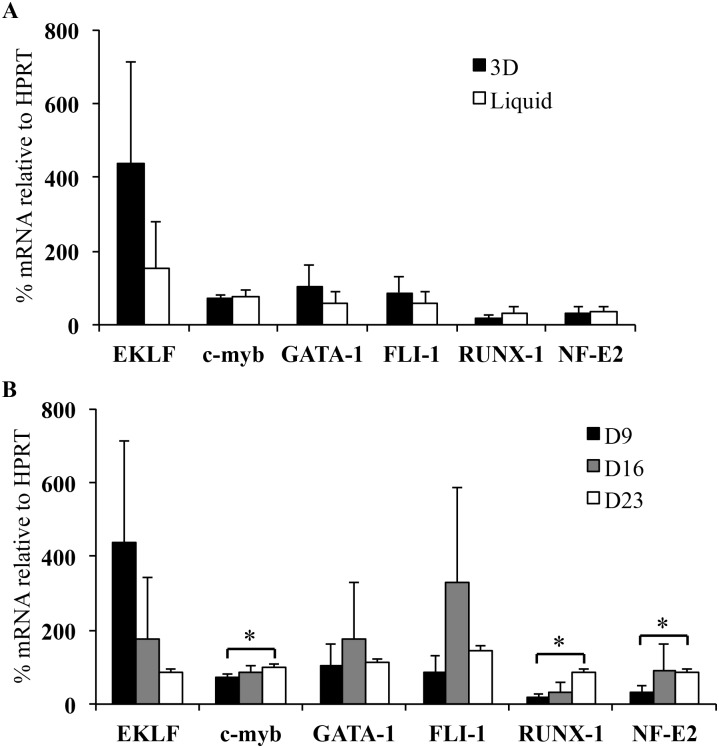
Fig 5. Transcriptional analysis of different genes involved in MK differentiation.
(A) Histogram representation of the expression levels of various genes determined by RT-qPCR in 3D (black bars) and liquid-culture (white bars) cells at day 9. (B) Histogram representation of time-dependent expression levels of various genes determined by RT-qPCR in 3D cells at days 9 (white bars), 16 (gray bars) and 23 (white bars). mRNA percentage of each gene was normalized to that of HPRT mRNA percentage and calibrated via the ΔΔCt method [27]. Data are means ± SEM of 3 independent experiments.*p<0.05. In 3D, days 16 and 23 were compared to day 9. Commercial references of the primer mixes used for qPCR are detailed in S1 Table.

