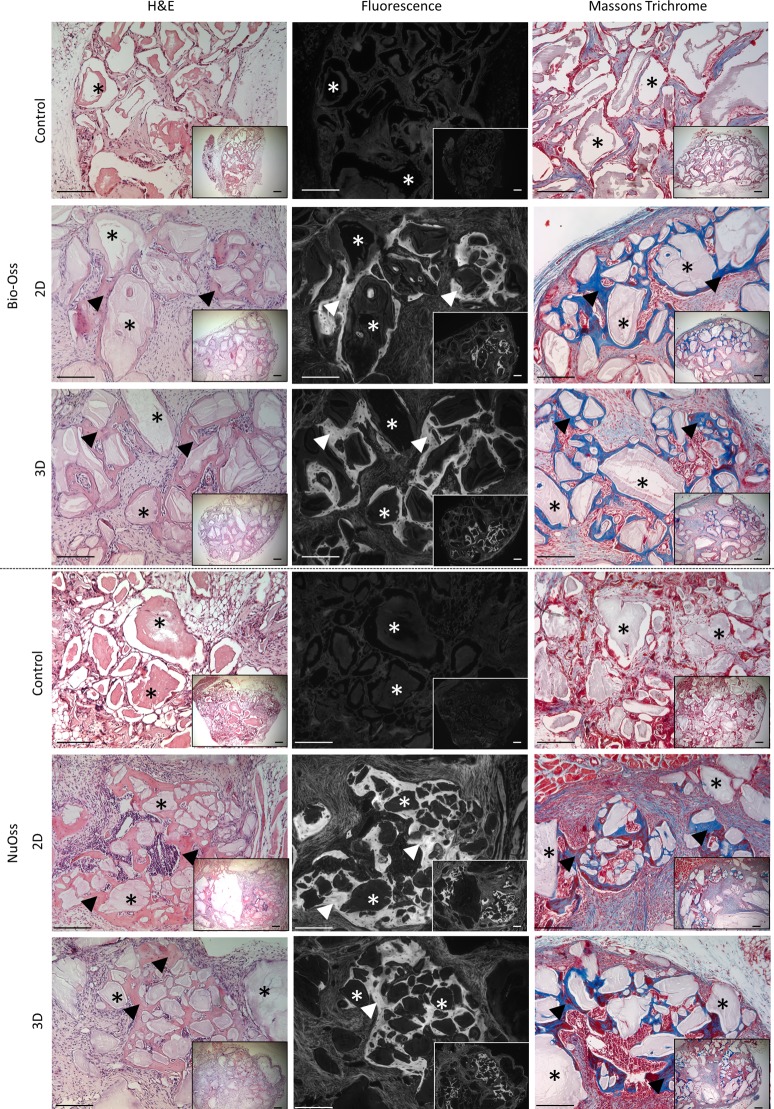
Fig 6. Histological analysis of explants obtained after the in vivo functional assessment of harvested cells.
Histological sections (H&E, H&E autofluorescence and Masson’s Trichrome) from Bio-Oss and NuOss constructs seeded with 2D and perfusion bioreactor expanded hPDCs respectively as well as the non-cell seeded controls after 8 weeks of in vivo. Asterisks indicate remaining Calcium Phosphate grains, arrow heads indicate newly formed bone with embedded osteocytes. Scale bar is 100 μm.

