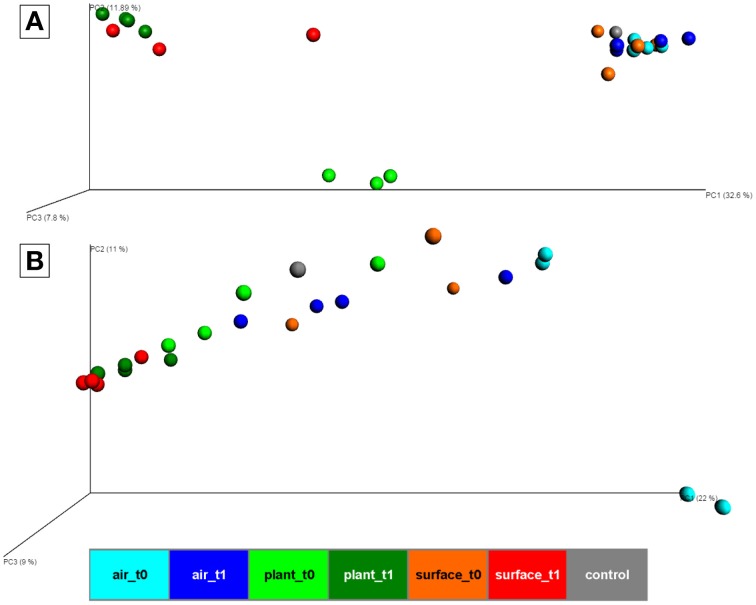
Figure 2.
PCoA plot with scaled coordinates by percent explained based on Bray-Curtis distances of rarefied OTU tables (4062 sequences for bacteria and 6839 sequences for fungi). (A) shows results of the bacterial 16S rRNA gene amplicons. (B) shows results of the fungal ITS amplicons. Spheres are colored according to the indoor space and the time points as highlighted in Figure 1. The control in gray was a sample from the lab environment outside the chamber after the isolation period.

