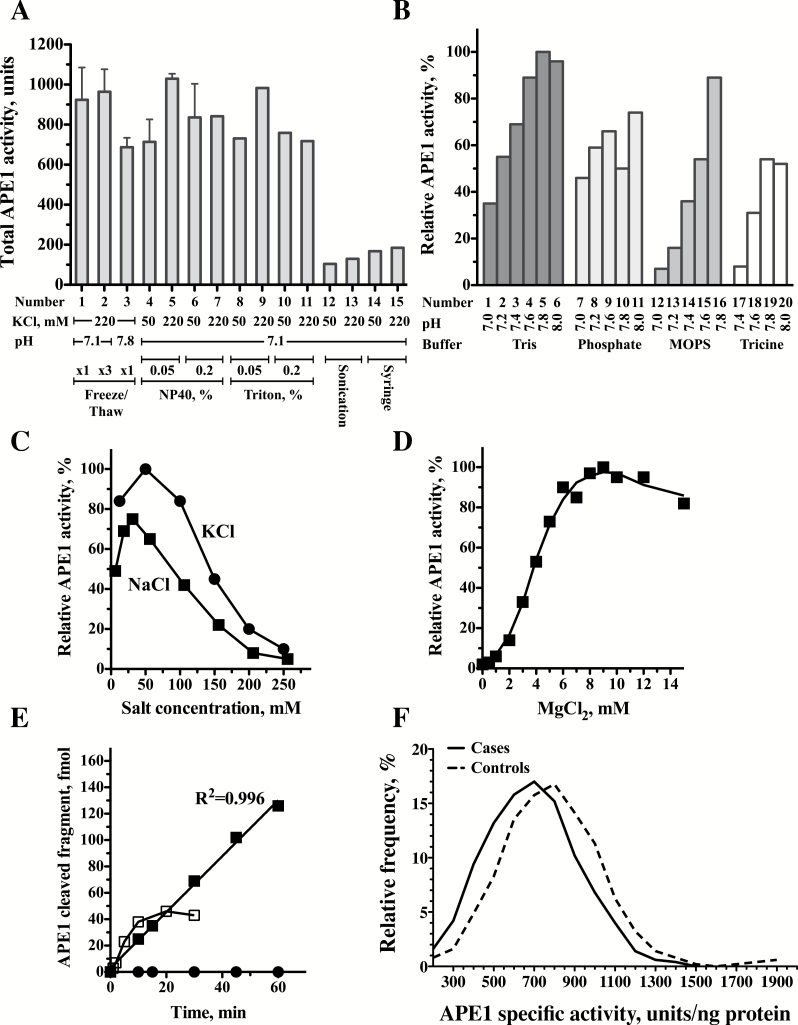
Figure 2.
Optimizations of the radioactivity-based APE1 DNA repair assay. (A) Optimization of the preparation of protein extracts. Protein extracts were prepared under various conditions and assayed for APE1 activity. Lanes 1–3 Freeze-Thaw extraction; Lanes 4–7 extraction with NP40; Lanes 8–11 extraction with Triton; Lanes 12–13 Extraction by sonication; Lanes 14–15 Extraction by Syringe. (B) Effects of buffers and pH on APE1 activity. APE1 enzyme activity is presented relative to the activity in Tris pH 7.8 (set as 100%). Lanes 1–6 Tris buffer; Lanes 7–11 Phosphate buffer; Lanes 12–16 MOPS buffer; Lanes 17–20 Tricine buffer. (C) Effect of different salt concentrations on APE1 activity. APE1 enzyme activity is presented relative to the activity in 50mM KCl (set as 100%) Closed circles, KCl; Closed squares, NaCl. (D) Effect of MgCl2 concentrations on APE1 activity. APE1 enzyme activity is presented relative to the activity in 9mM MgCl2 (set as 100%). (E) Time course of APE1 DNA repair activity in protein extracts prepared from peripheral blood mononuclear cells. Closed squares, reaction under optimized conditions; Open squares, reaction before optimization; Closed circles, control DNA without the abasic site. (F) Relative frequency plots for APE1 activities were determined in 99 case patients (continuous line) and 99 matched controls subjects (dashed line). The relative frequencies as percent were plotted using GraphPad Prism version 5.00, with bin width of 100 units that was automatically chosen by the software. The relative frequency plots were smoothed by two neighbors on each size, zero order of polynomial smoothing. Case patients exhibit a shift to lower values of APE1 enzyme activity.

