
Fig. 2.
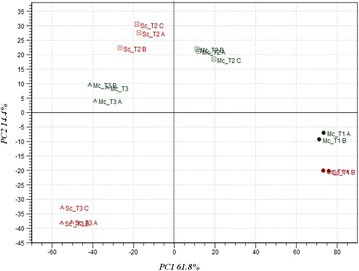
Principal Component Analysis of the alterations registered in the transcriptome of S. cerevisiae along a wine fermentation performed in single culture or in consortium with H. guilliermondii. The PCA plot shows variation in expression levels of S. cerevisiae genes either in single- (Sc) or mixed-culture (Mc) at each fermentation stage (24, 48 and 96 h)