Figure 3.

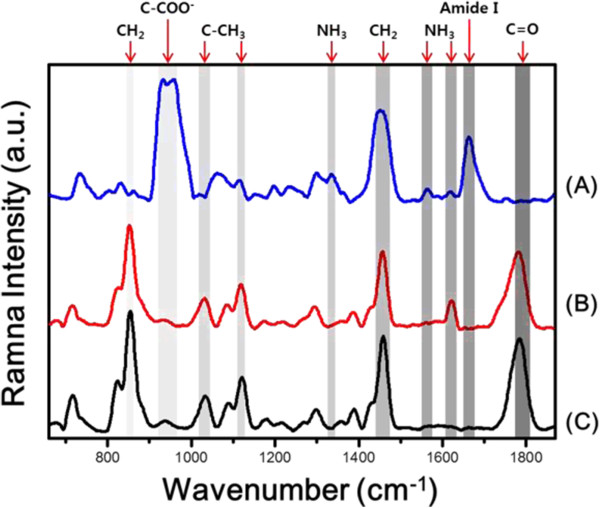
Compositional analysis of electrospun nanofibers by Raman spectroscopy. Raman spectra of RGD-M13 phages (A), RGD-M13 phage/PLGA nanofibers (B) and pure PLGA nanofibers (C).

Compositional analysis of electrospun nanofibers by Raman spectroscopy. Raman spectra of RGD-M13 phages (A), RGD-M13 phage/PLGA nanofibers (B) and pure PLGA nanofibers (C).