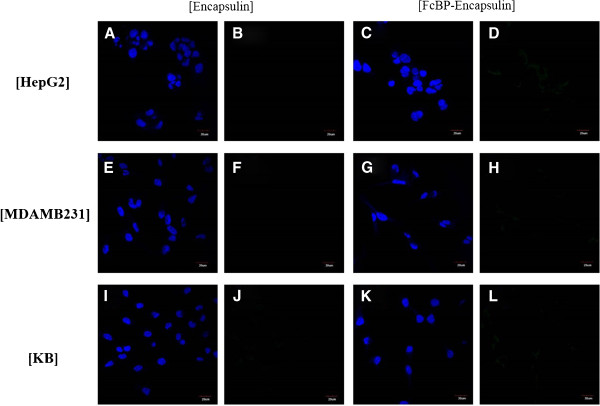
Figure 4.

Fluorescent microscopic images. Fluorescent microscopic images of HepG2 cells (A, D) treated with f-encapsulin (A, B) and fFcBP-encapsulin (C, D). Fluorescent microscopic images of MDA-MB-231 cells (E, H) treated with f-encapsulin (E, F) and fFcBP-encapsulin (G, H). Fluorescent microscopic images of KB cells (I, L) treated with f-encapsulin (I, J) and fFcBP-encapsulin (K, L). DAPI (A, C, E, G, I, K) and fluorescein (B, D, F, H, J, L) were represented.
