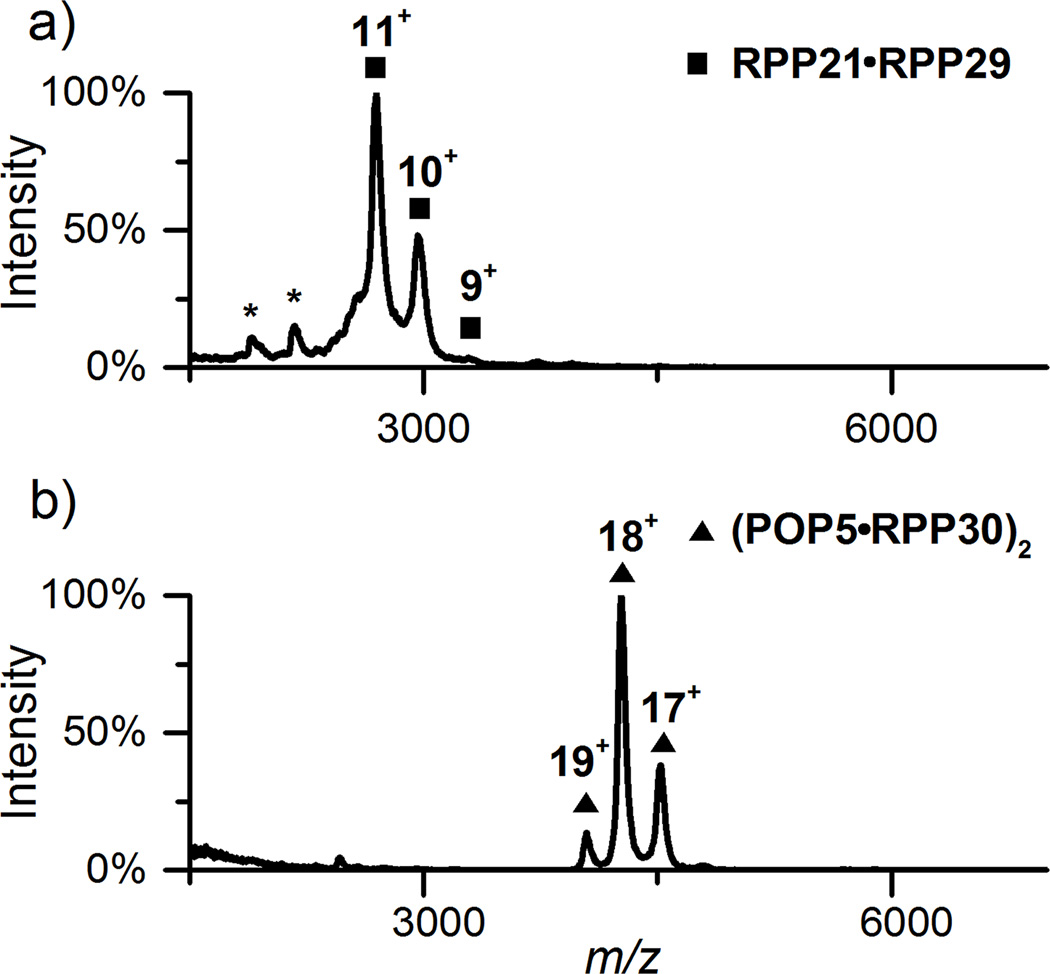
Figure 1.
Native MS spectra of Pfu RPP21•RPP29 heterodimer (a) and (POP5•RPP30)2 heterotetramer (b) in 500 mM NH4OAc. In each spectrum, the dominant peaks and charge states are indicated. Asterisks indicate the 7+ and 8+ states of RPP29, a small amount likely generated from the binary complex during storage or analysis. See Table S-1 for predicted and observed masses.

