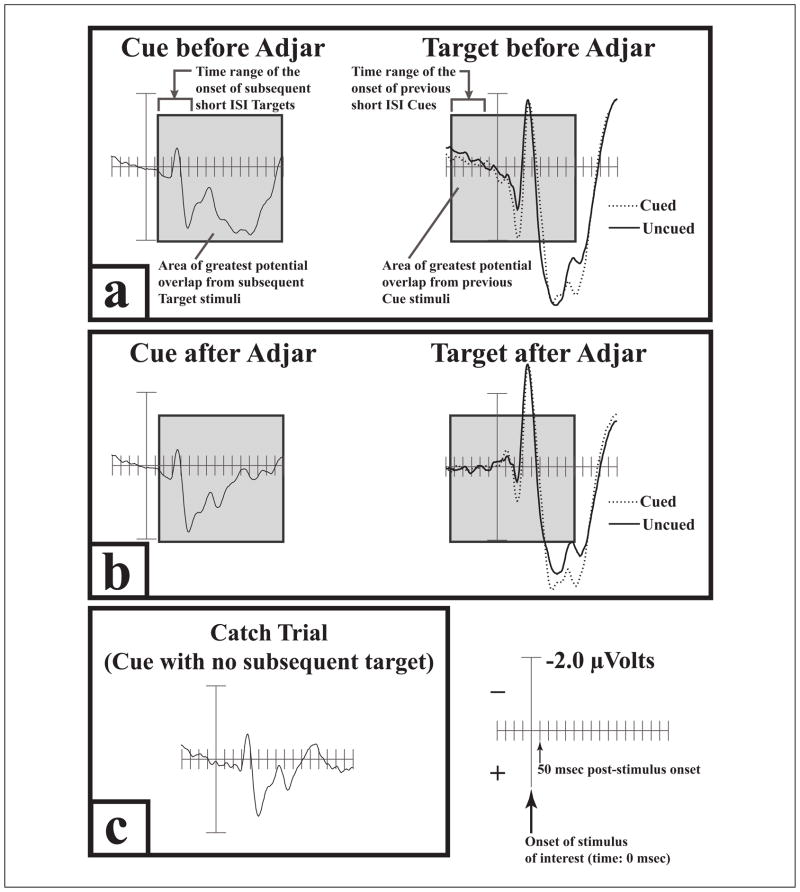
Fig. A1.
Illustration of the effectiveness of the Adjar procedure. Shown in (a) are event-related potentials (ERPs) to cues and targets with short interstimulus intervals (ISIs), before being filtered with the Adjar procedure. For each ERP plot, the vertical axis indicates the onset of the stimulus. The gray boxes indicate the likely region where overlapping components could be most severely contaminating the ERP. The time ranges over which adjacent stimuli were presented are indicated above the gray boxes. Shown in (b) are ERPs to cues and targets with short ISIs, after being filtered with the Adjar procedure. The ERP to the cue stimulus on catch trials is shown in (c). All ERPs shown here are averaged over occipital scalp sites contralateral to the visual field of stimulus presentation (sites OL and OR).

