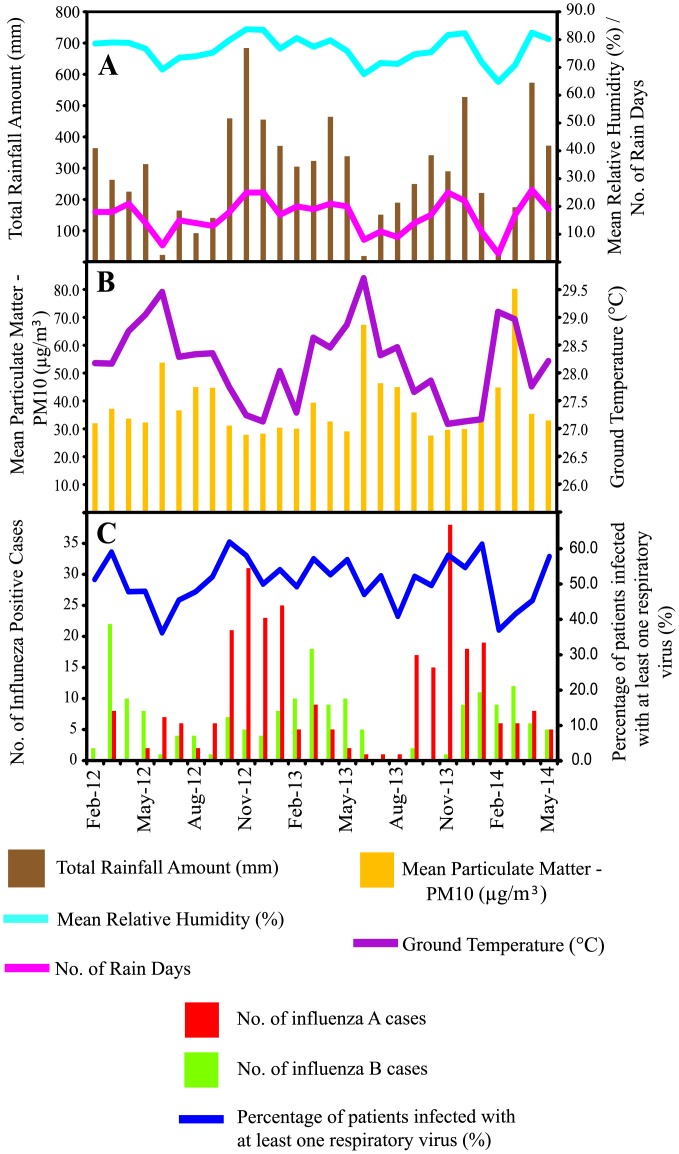
Fig 1. Seasonality of influenza infections and meteorological factors in Malaysia between 2012 and 2014.
(A) Total Rainfall Amount (mm), Mean Relative Humidity (%) and Number of Rain Days. (B) Mean Particulate Matter—PM10 (μg/m3) and Ground Temperature (°C). (C) Monthly distribution of influenza A and B infections in Kuala Lumpur, Malaysia.

