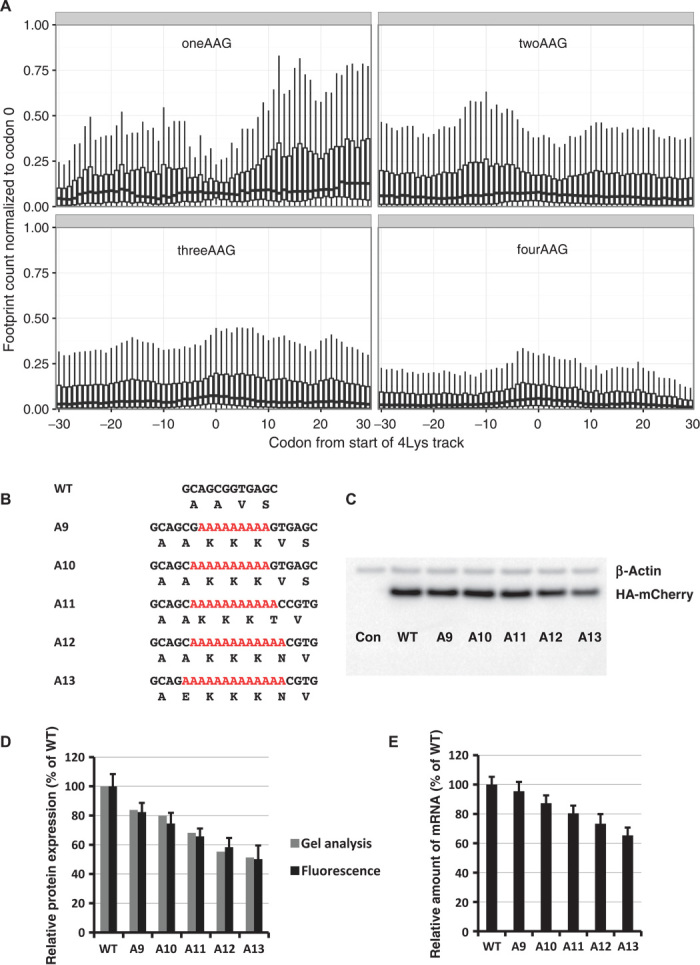
Fig. 2. The effect of codon usage in polylysine tracks on translation and protein levels.

(A) Occupancy of ribosomal footprints for regions around different codon combinations for four lysine tracks. All combinations of one, two, three, and four AAG codons per group are shown. Data for four AAA codons are not shown because only a single gene has such a sequence. The upper and lower “hinges” correspond to the first and third quartiles (the 25th and 75th percentiles). The upper and lower whiskers extend from hinges up or down at a maximum of 1.5*IQR (interquartile range) of the respective hinge. (B) Sequences of HA-(A9–A13)-mCherry constructs used in electroporation experiments. (C) Western blot analyses of HA-(A9–A13)-mCherry constructs 48 hours after electroporation (HA and β-actin antibodies). (D) Normalized protein expression using LI-COR Western blot analyses or in vivo mCherry fluorescence measurement. β-Actin or fluorescence of coexpressed GFP construct was used for normalization of the data. Each bar represents the percentage of wild-type mCherry (WT) expression/fluorescence. (E) Normalized RNA levels of HA-X-mCherry constructs. Neomycin resistance gene was used for normalization of qRT-PCR data. Each bar represents the percentage of wild-type mCherry (WT) mRNA levels.
