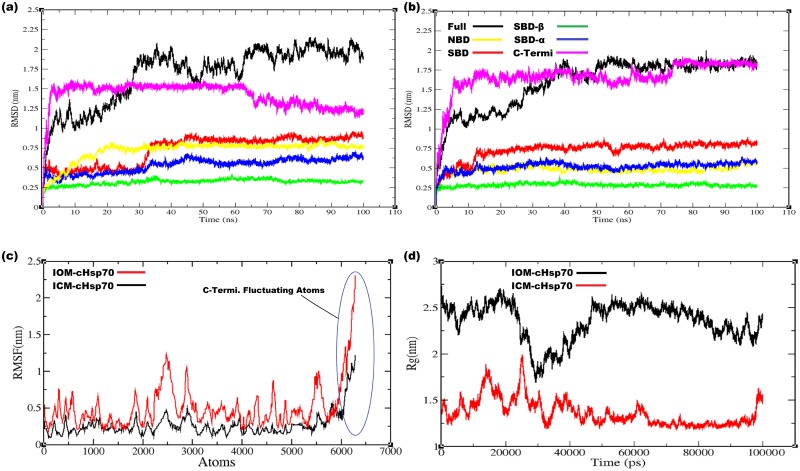
Fig 2.
(a) The backbone RMSD for Full structure of IOM-cHSP70 having NBD, SBD, SBD-β, SBD-α and C-Terminal computed with respect to simulation time (b) The backbone RMSD for Full structure of ICM-cHSP70 having NBD, SBD, SBD-β, SBD-α and C-Terminal computed with respect to simulation time(c) RMSF plots of ICM-cHSP70 and IOM-cHSP70 showing atomic fluctuations in (nm) with respect to each atom of the protein. (d) The Radius of gyration (Rg) plot for both proteins is represented by different color scheme with respect to simulation time.

