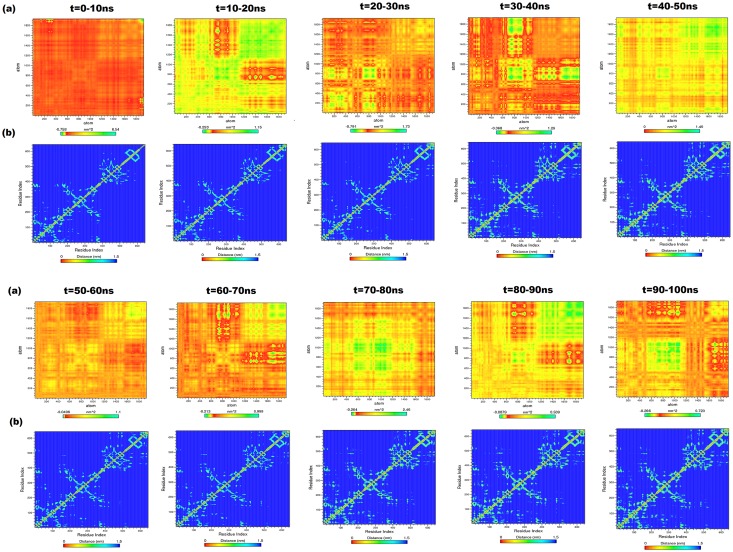
Fig 6.
(a) Heat maps for anti-correlated and correlated motions between the backbone atoms of every successive 10ns intervals for ICM-cHSP70. The green color clusters showing the atoms moving together, the yellow color cluster showing mediatory motion and red colored clusters represent residues moving in opposite directions. The range of length for each map was depicted in indication bar. (b) The contour map for every successive interval for the trajectories of ICM-cHSP70. The diagonal line represents the zero distance between the residues paired with themselves while cyan color spot represents the spinning motions distance (nm) for each residue pair, during the course of simulation interval.

