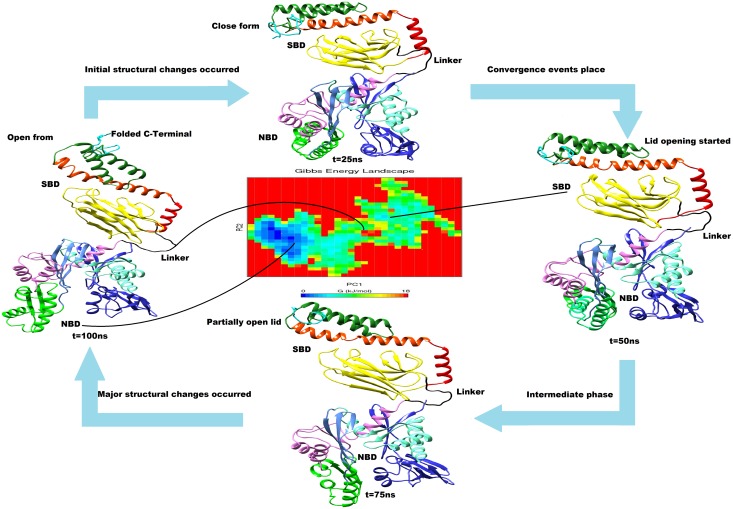
Fig 7. Structural and functional identification of cHSP70 structure during simulation having similar color code as defined in Fig 1a.
The averaged structure for each interval with structural changes was shown. Gibbs free energy landscape represents the frequency of subunit folding identified via Principal Component Analysis (PCA). The minimum Gibbs free energy (blue color spot) shows minimum folding rates in domains while the intermediate and higher energy (green and yellow spots) shows intermediate and higher folding rates in subunits of cHSP70.

