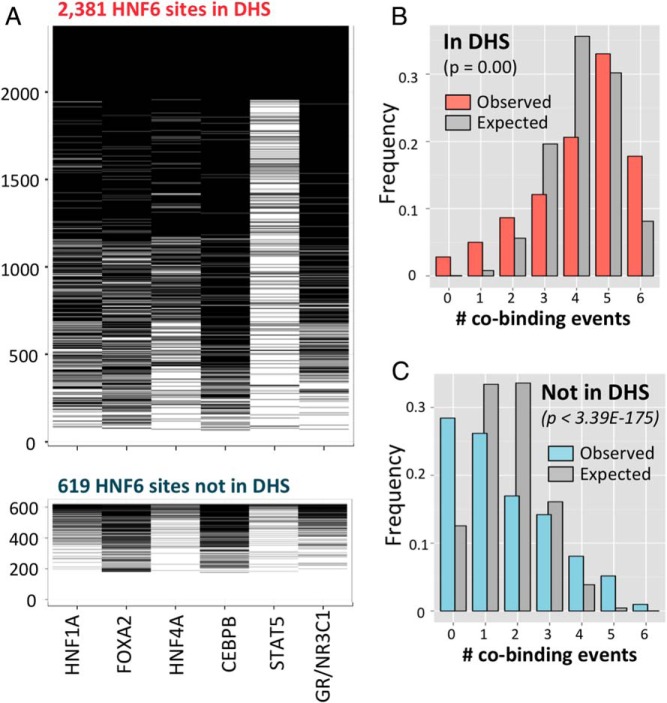
Figure 7.
Cobinding frequency distributions for top-scoring 3000 HNF6 peak summit regions. Frequencies of cobinding events for the peak summit regions of 3000 top scoring HNF6 peaks are shown. A, Heat maps of transcription factor cobinding events for 2381 HNF6 peaks at DHS (top) and for 619 HNF6 peaks not at DHS (bottom). Each black bar indicates a cobinding event for the transcription factor marked at bottom. In each heat map, HNF6 peaks are ordered by the number of factors cobound, ranging from 6 factors (top) to 0 factors (bottom). B, Distribution of number of cobinding events for the sets of HNF6 peak summit regions at DHS, with red bars representing the observed frequencies of 0–6 cobinding events, and gray bars representing the expected distribution based on the percentage overlaps with individual cofactors (see Materials and Methods). C, Distribution of number of cobinding events for the sets of HNF6 peak summit regions not at DHS, with blue bars representing the observed frequencies of 0–6 cobinding events, and gray bars representing the expected distribution based on the percentage overlaps with individual cofactors determined experimentally (see Materials and Methods).

