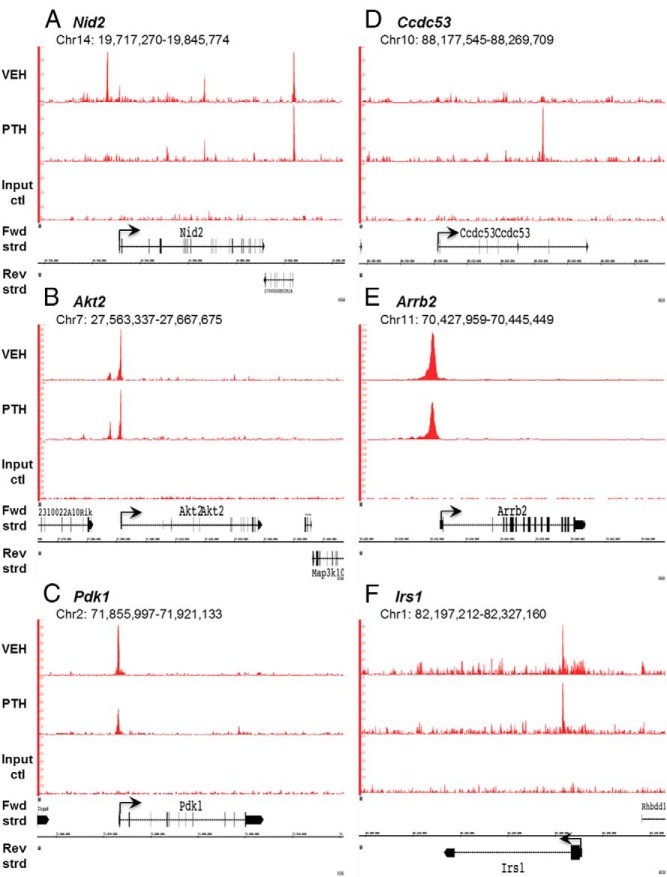
Figure 8.
ChIP-seq reveals Nmp4 binding profiles at specific gene loci. Mouse MC3T3-E1 cells were seeded into 21 150-mm plates at an initial density of 50 000 cells/plate (320 cells/cm2) and maintained in α-MEM complete medium + ascorbic acid for 14 days. Before harvest cells were treated with 25nM hPTH (1–34) or vehicle control for 1 hour. Processing for ChIP-seq analysis was performed as described in Materials and Methods. Sequences (50-nt reads, single end) were aligned to the mouse genome (mm10) using the Burrows-Wheeler algorithm. Alignments were extended in silico at their 3′-ends to a length of 150 bp, which is the average genomic fragment length in the size-selected library, and assigned to 32-nt bins along the genome. Nmp4 (Znf384) peak locations were determined using the MACS algorithm (v1.4.2) with a cutoff of P = 1e-7. The genomic loci including the chromosome number and nucleotide interval are indicated. Read scales are indicated on the y-axis. An arrow indicates the transcriptional start sites and direction of transcription for each of the genes; vertical boxes within the gene indicate exons. The Nmp4 ChIP-seq gene profiles include (A) Nid2 (B) Akt2, (C) Pdk1, (D) ccdc53, (E) Arrb2, and (F) Irs1. The input DNA profiles were devoid of peaks.

