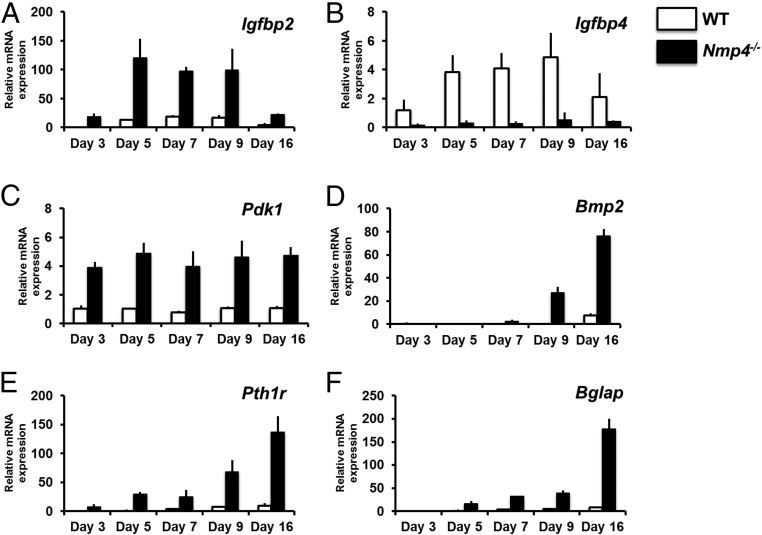
Figure 9.
Comparison of mRNA expression profiles derived from nondifferentiating (d 3) and osteogenic-differentiating (d 5–16) WT and Nmp4−/− cells. All transcript levels are compared with WT day 3 providing a time course of expression. mRNA profiles (A) Igfbp2, (B) Igfbp4, (C) Pdk1, (D) Bmp2, and (E) Pth1r were derived from the TLDA system (Format 96a; Applied Biosystems) performed on a QuantStudio 7 Flex Real-Time PCR System and normalized with GusB. F, Bglap mRNA profile qRT-PCRs were performed on an Eppendorf Mastercycler RealPlex2 using Rplp2 Mm03059047_gH) as the normalizer, as previously described (Robling et al [13]). Comparison of profiles using GusB and Rplp2 as the normalizer showed no differences in the shape of the expression profiles.

