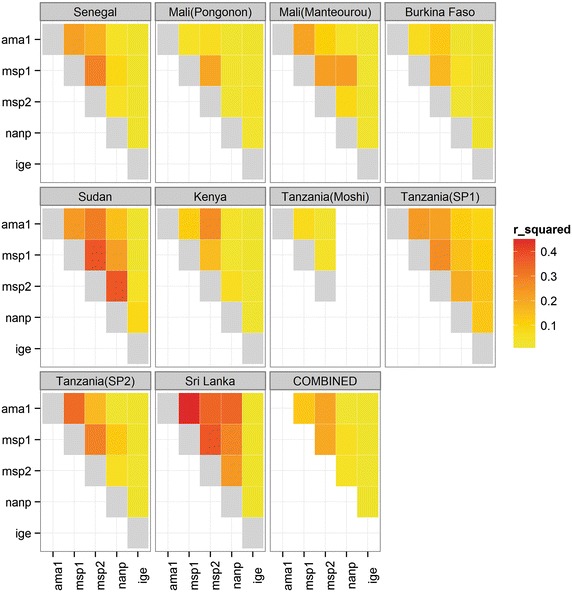
Fig. 2.

Heatmap matrix plot of correlations between logged antibody titres at each site. Pairwise correlations between logged anti-AMA1, anti-MSP1, anti-MSP2, anti-NANP, and total IgE calculated as R-squared. Strongest correlations shown in red and weakest correlations shown in yellow. Correlations of antibodies with themselves shown here in grey.
