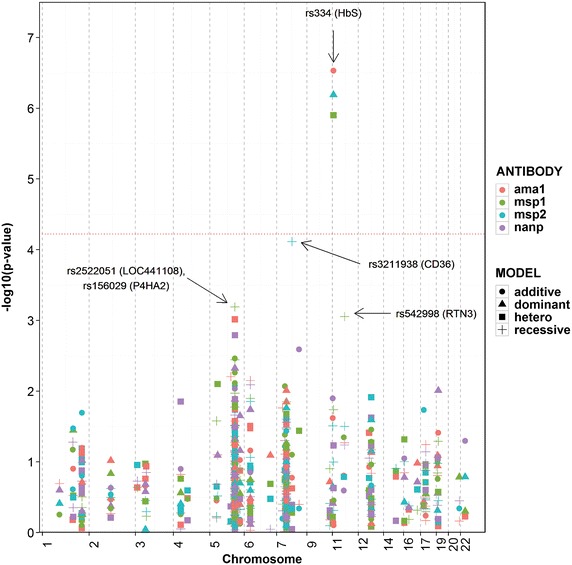
Fig. 4.

Plot for 178 SNPs with logged anti-malarial antibody levels. Values of –log10 p-values plotted against chromosomal positions; only the lowest meta-analysis p-value for each SNP-antibody association is plotted. The red dotted line indicates a Bonferroni threshold p-value of 6 × 10⁻⁵. Each colour represents a different anti-malarial antibody while the shape of the point represents the genetic model of best fit for the SNP-antibody association: (circle) for additive, (triangle) for dominant, and (square) for heterozygote and (plus) for recessive. Adjusted for age, gender, microscopy result, village (>20), ethnicity (>20), sample month (>20) and study.
