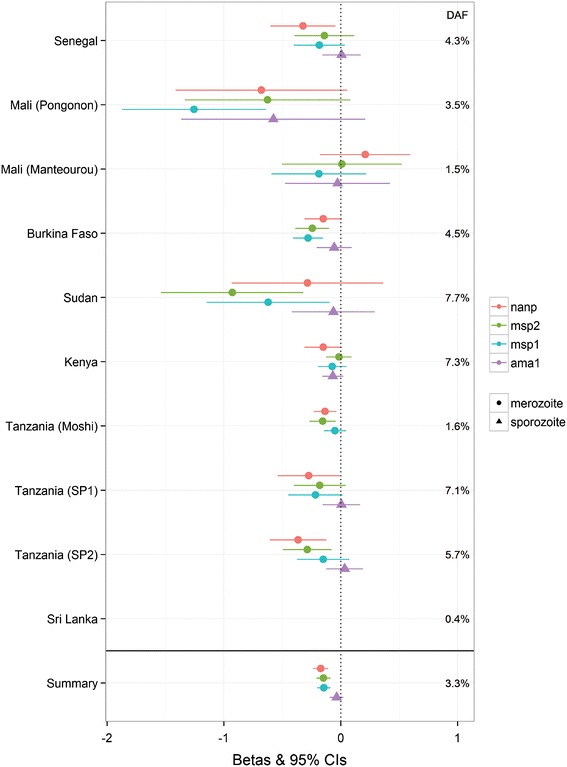
Fig. 5.

Forest plot of the HbS (rs334) association with antibodies to AMA1, MSP1, MSP2 and NANP. Points correspond to beta values obtained from meta-analysis of results obtained from linear regression models of SNP with logged antibody levels, adjusted for relevant clinical covariates. Lines represent 95 % confidence intervals. Each colour represents a different antibody while the shape of the point represents the antibody type: (circle) for anti-merozoite and (triangle) for anti- sporozoite. Summary of meta-analysis betas obtained from combined data are represented as (square). Summary P-values: ama1 = 2.9 × 10−07; msp1 = 1.2 × 10−06; msp2 = 6.5 × 10−07; nanp; = 0.2.
