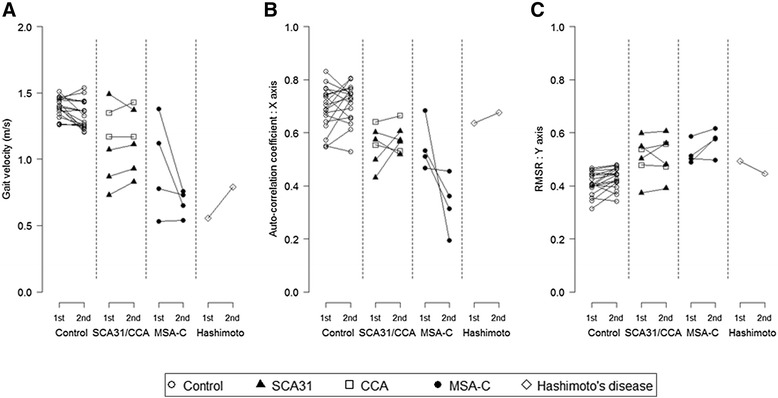
Fig. 3.

Chronological changes of the patients and control subjects. a Gait velocity. b Auto-correlation coefficient in the X axis. c The ratio of root mean square in each direction to the root mean square vector magnitude (RMSR) in the Y axis

Chronological changes of the patients and control subjects. a Gait velocity. b Auto-correlation coefficient in the X axis. c The ratio of root mean square in each direction to the root mean square vector magnitude (RMSR) in the Y axis