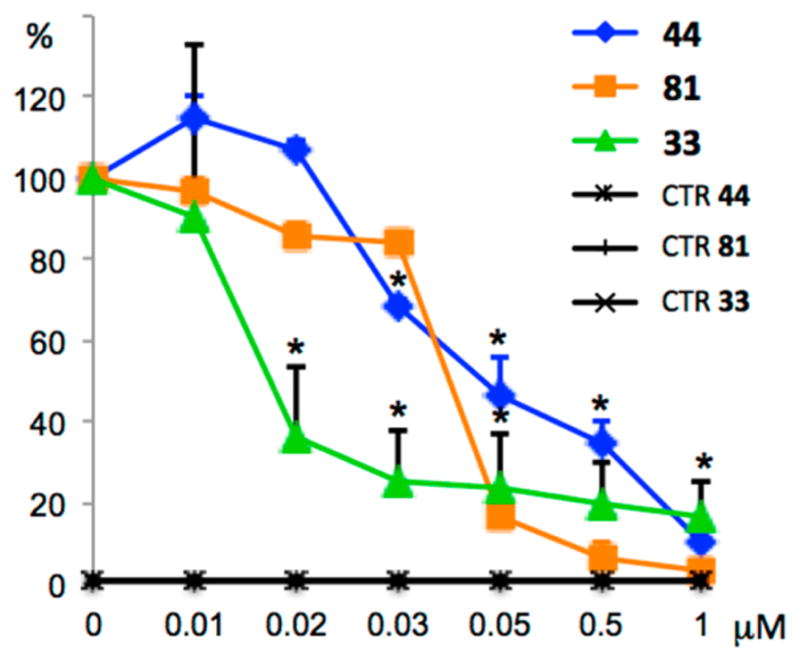
Figure 10.

Inhibition of endogenous Hh signaling in Shh-LII cells by 33, 44, and 81. Dose–response curve of the indicated compounds in SAG-treated cells in comparison with untreated Shh-Light II cells as a control (CTR). The treatment time was 48 h, and normalization was against Renilla luciferase. Data are from three independent experiments. Error bars indicate SD. An asterisk indicates P = 0.05 vs CTR.
