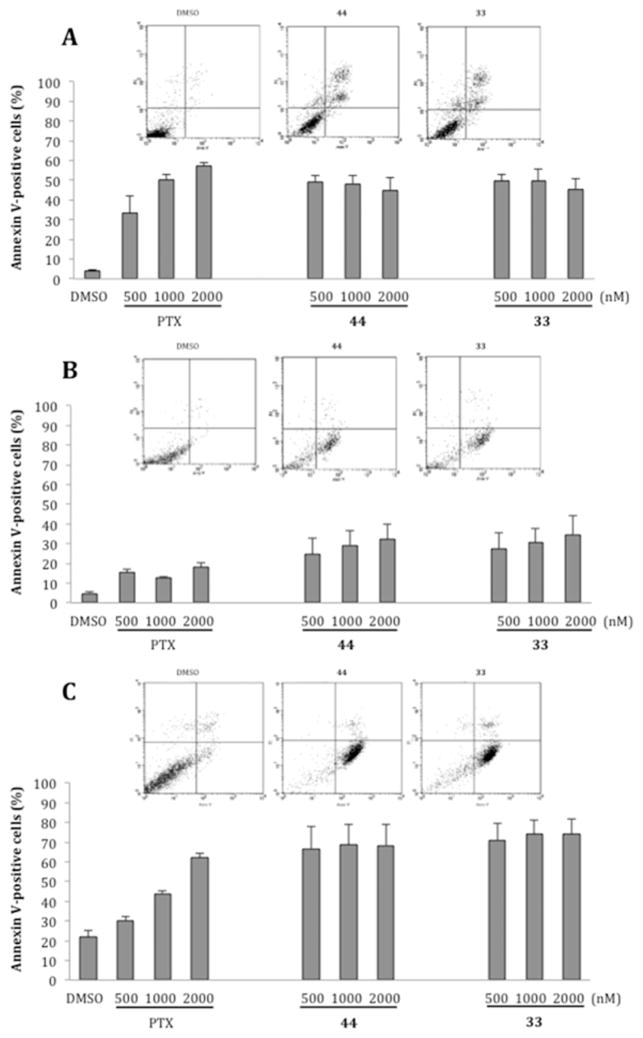
Figure 7.
Cell death cytometric analysis of PC-3 (A), RD (B), and HepG2 (C) cells treated with 0.1% DMSO or 500, 1000, or 2000 nM 33, 44, or PTX for 48 h. Flow cytometric profiles of cell populations following treatment with DMSO or 2000 nM 33 or 44 are at the top of each panel (annexin V–FITC staining on the x axis and PI on the y axis). Histograms represent the percentage of cells in early apoptosis (annexin V–FITC staining) and late apoptosis (annexin V–FITC and PI staining) expressed as mean values ± SD calculated from three independent experiments.

