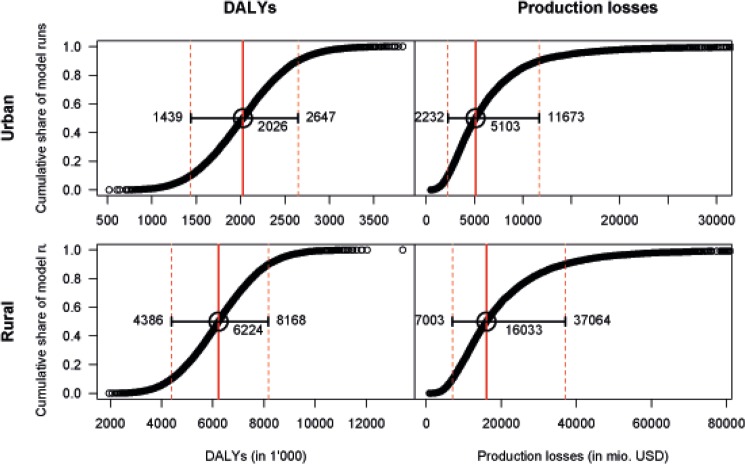
Fig 6. Multivariate sensitivity analysis by type of social cost and area of residence.
Distribution of ordered results from 10,000 model runs with input parameters varying randomly according to predefined distributions. The curves show the share of all model runs that resulted in costs of a given size or lower. The solid vertical line shows the median result of all model runs. The dashed lines mark the values between which 80% of all model runs lay.

